US Dollar Price Action Setups: EUR/USD, GBP/USD, USD/CAD, USD/JPY
August 14, 2025 22:37US Dollar Talking Points:
- The US Dollar has continued to pullback over the past week but notably bears haven’t been able to break the higher-low structure that’s built so far in Q3.
- Perhaps more interesting than the digestion on the chart is what’s behind it, as the Fed sounded less-dovish at the July 31 FOMC meeting and as we saw last week, inflation remains high via CPI and PPI reads, complicating the scenario around rate cuts that markets have aggressively priced-in.
- On the other side of the coin President Trump wants rate cuts despite the inflation data and appears to be on the cusp of re-making the Fed more to his taste. Dissenters from the July meeting have already been named as candidates for the next Fed Chair position and next week we’ll hear from Chair Powell at the Jackson Hole Economic Symposium.
Next week is a big one for the US Dollar as we get the Jackson Hole Economic Symposium and what will likely be FOMC Chair Jerome Powell’s final speech at that meeting atop the Federal Reserve. Powell’s term concludes next year and it doesn’t seem as though President Trump is warm to the idea of re-nominating him for the top spot at the bank, and this brings us to the primary point of interest for that meeting which will be whether or not Chair Powell uses the opportunity to signal interest rate cuts on the horizon.
To this point, Powell has remained less-dovish than what markets have seemingly expected and President Trump has ramped up the demand for rate cuts, continually calling Powell ‘too late.’ But as we saw last week with both Core CPI and PPI data, inflation in the US remains elevated and cutting interest rates risks stoking inflation even-higher. At the FOMC rate decision in July, Powell commented that policy didn’t seem too restrictive given that inflation was climbing and the labor market, at least from the perspective of the unemployment rate, looked healthy. Since then we had a jarring revision to the past two months of NFP numbers and despite the fact that the unemployment rate came in at the expected 4.2% which Powell had previously noted was close to full employment, markets have ramped up their expectation for rate cuts.
As of this writing there’s an 88.8% probability of a cut in September, and that had shown at 99.9% earlier this week after US Treasury Secretary Scott Bessent said that he could see a 50 bp cut at that meeting. Perhaps more important is the rest of the year and at this point, there’s an 84.7% probability of at least one more cut into the end of the year, and a 38.9% chance of two more cuts into the end of the year.
That would be a heavy pace of softening and this is an economy that has seen prices continue to rise as seen through all of Core PCE, CPI and Core CPI, and most recently, PPI.
But that data has seemed to matter little as President Trump has driven hard for accommodation from the FOMC and that’s been a dominating factor for markets so far this year as stocks have boosted and the US Dollar has sold off.
Trump’s drive for USD-weakness has been pretty clear and he even said as much in late-July, commenting, “So when we have a strong dollar, one thing happens: It sounds good. But you don’t do any tourism. You can’t sell tractors, you can’t sell trucks, you can’t sell anything,” he went on to say, “it is good for inflation, that’s about it.”
The bigger question here is whether markets will cooperate with that given that the Greenback has already been in a hard sell-off for much of the year, and given that weakness, as President Trump had noted with the Dollar’s relationship with inflation, inflation numbers have boosted thereby complicating the decision at the FOMC.
Interestingly, when the Fed cut rates last year the USD bottomed right around the first rate cut. And then as the Fed continued to cut the Dollar took on a strong bullish tone through Q4 that lasted into the New Year open. So, even if we do get rate cuts, it doesn’t mean that the USD has to sell-off, and we saw this vividly in last year’s ‘buy the rumor, sell the news’ scenario.
At present, the US Dollar continued to hold higher-lows over the past week that have built so far in Q3. There’s also a long-term trendline in-play as looked at in the Tuesday webinar, and as of right now the USD remains very near the same swing-low that was in-play back in April.
US Dollar Daily Chart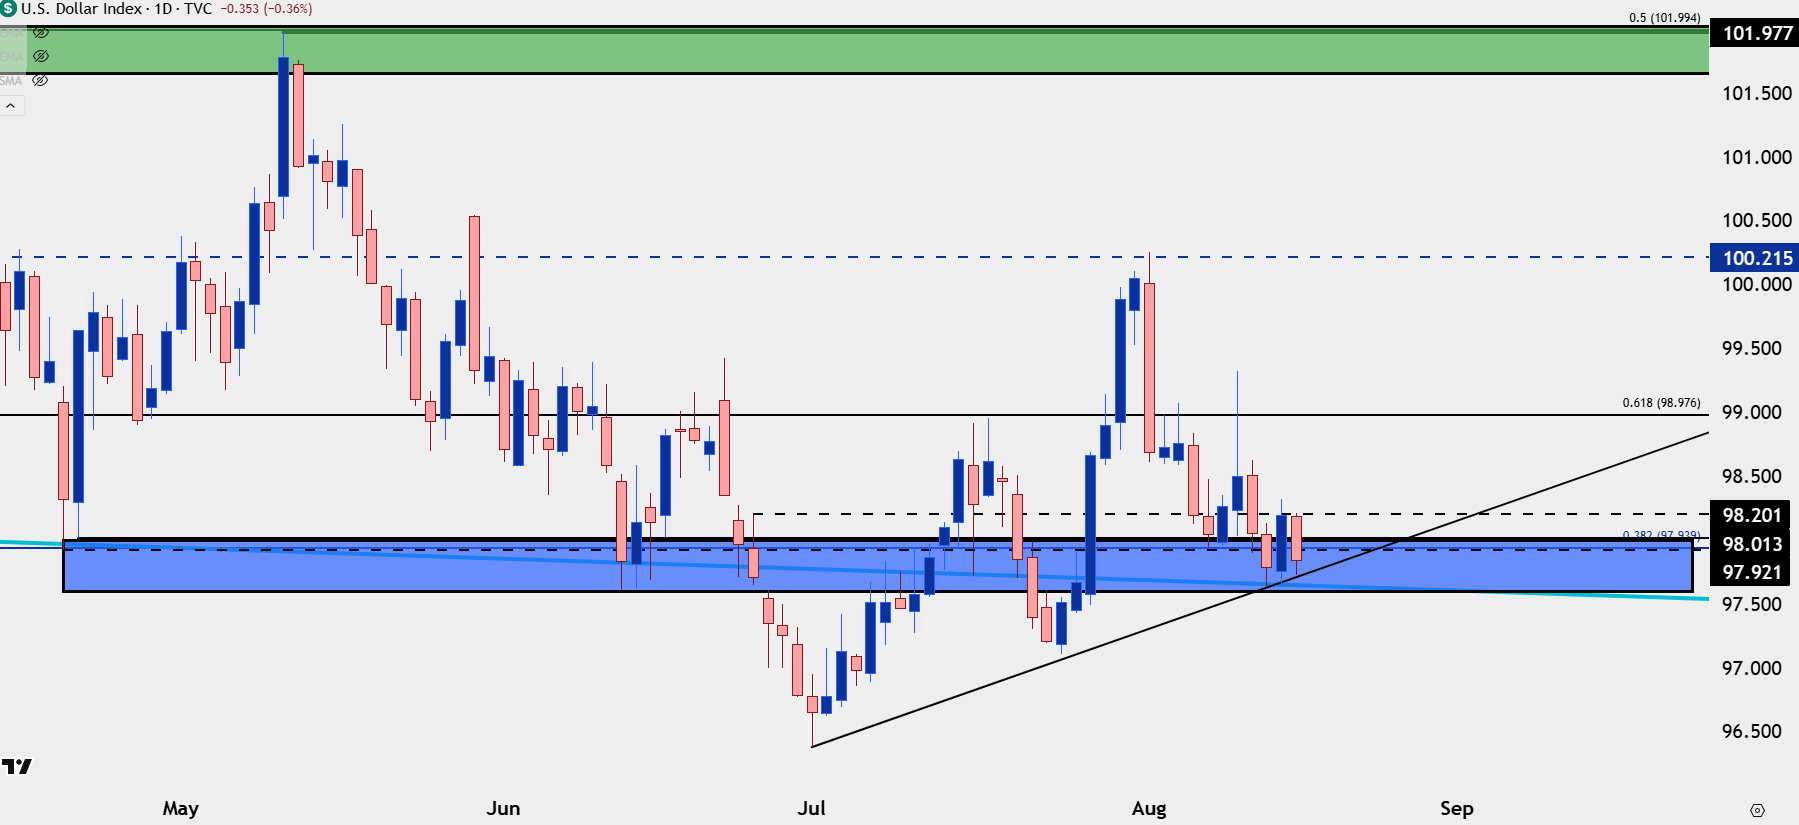
Chart prepared by James Stanley; data derived from Tradingview
EUR/USD
For USD-strength I remain interested in EUR/USD, driven by a similar premise as the above with the pair so far holding lower-highs in Q3 trade. Sellers had dipped down for a trendline test on Thursday morning that has so far held support, and this sets up a resistance test at the 1.1748 level, which is a key Fibonacci level from the 2021-2022 major move.
There’s now a rising wedge in the pair and that’s a formation often tracked with aim of bearish reversal. The trendline from the Q3 lower-highs projects right around that 1.1748 level as well as the upper bounds of the wedge into early-trade next week.
EUR/USD Four-Hour Price Chart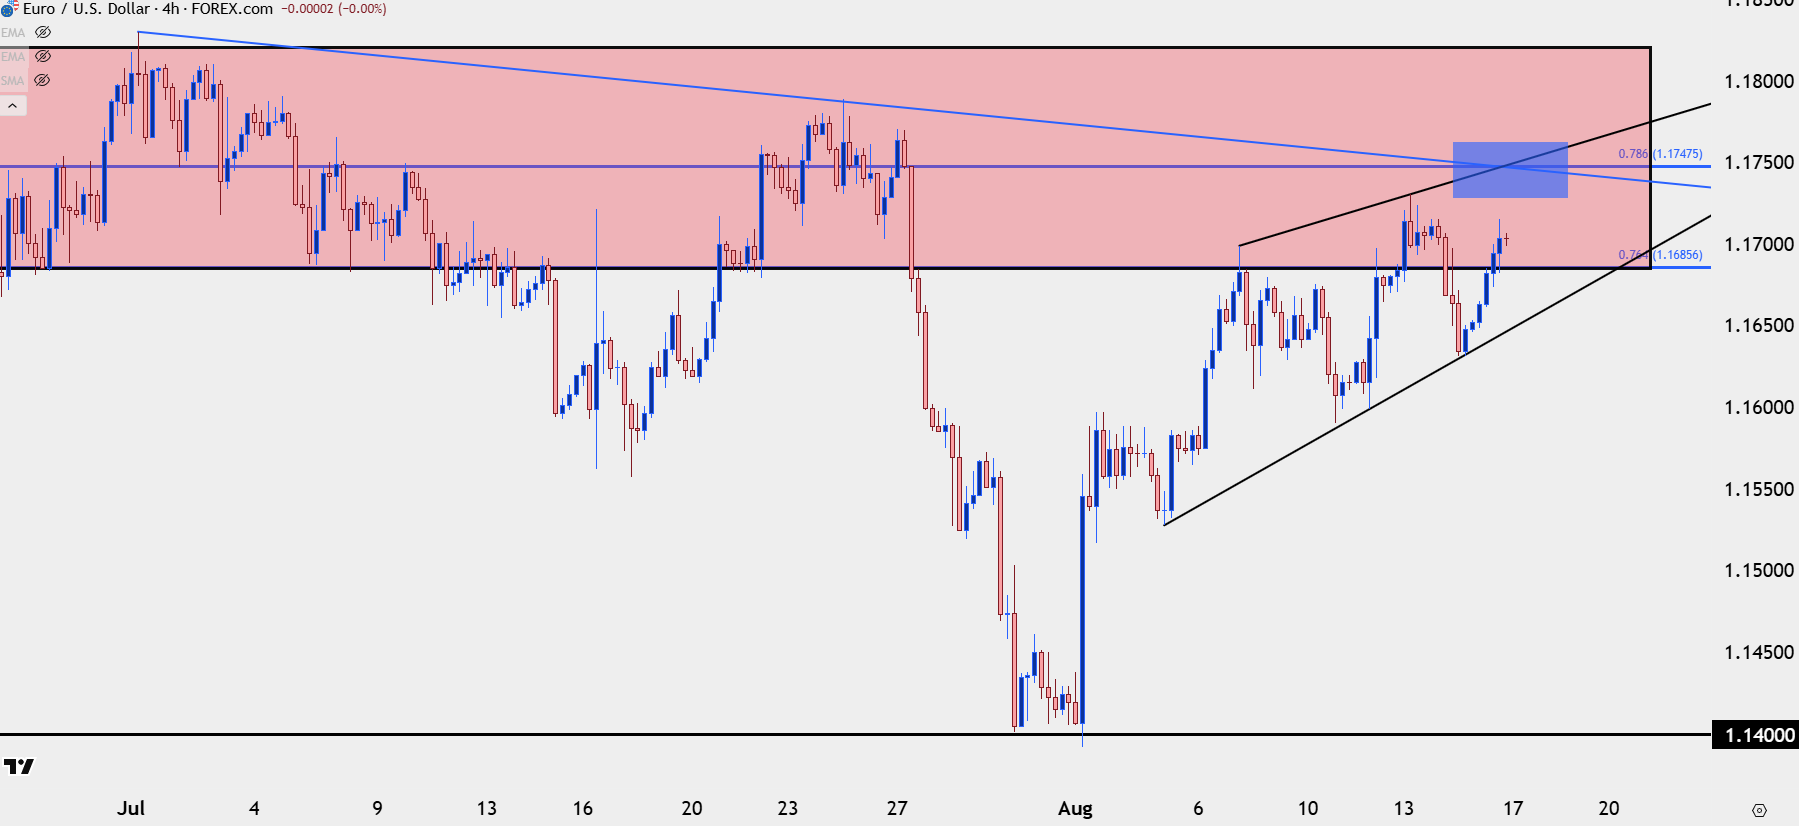
Chart prepared by James Stanley; data derived from Tradingview
GBP/USD
If looking for USD-weakness I think that GBP/USD remains one of the more attractive pairs. This week saw a continued extension in the August rally and even as the USD started to show signs of stalling over the past week, GBP/USD continued to jump, all the way into resistance at the 1.3593 level, which was a swing-high from late-May.
At this point, there’s support structure around the 1.3500 level that GBP/USD grinded through on Tuesday and there hasn’t yet been a check back and re-test of support there. Overhead, it’s the 1.3670-1.3675 zone that stands out as a deeper point of resistance potential.
GBP/USD Four-Hour Chart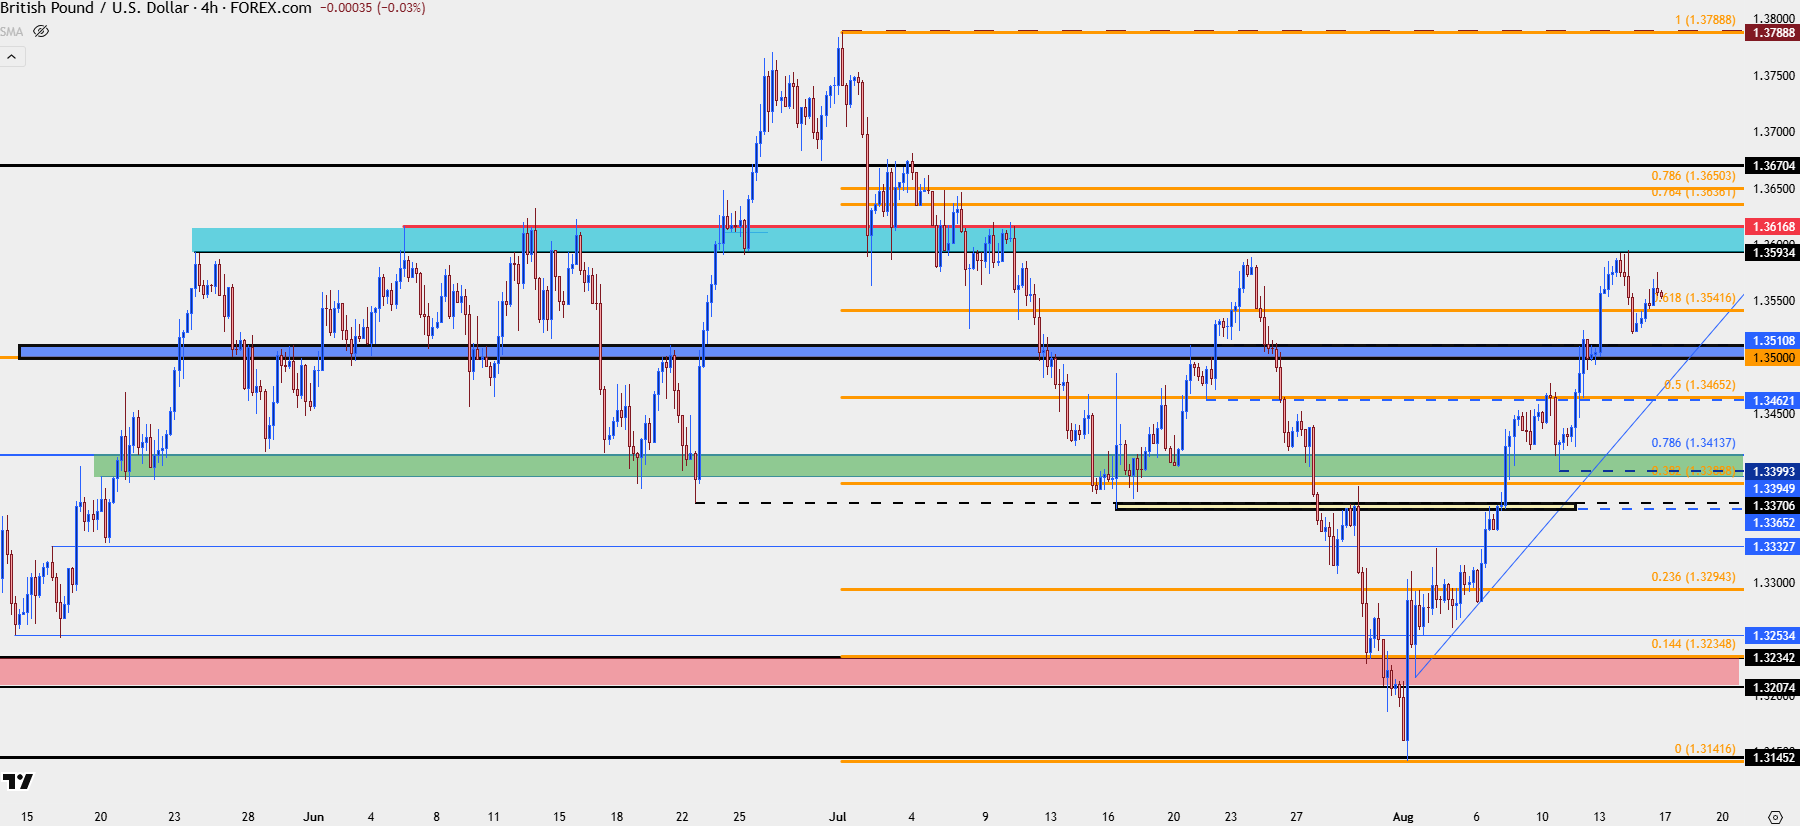
Chart prepared by James Stanley; data derived from Tradingview
USD/CAD
While it’s been a red week for the US Dollar, it’s been green for USD/CAD, and the pair retains bullish structure following the pullback to and hold of support at prior resistance. I looked at an updated setup here on Thursday and that remains of interest, and for USD-strength, I think the technical backdrop in USD/CAD remains attractive.
USD/CAD Daily Price Chart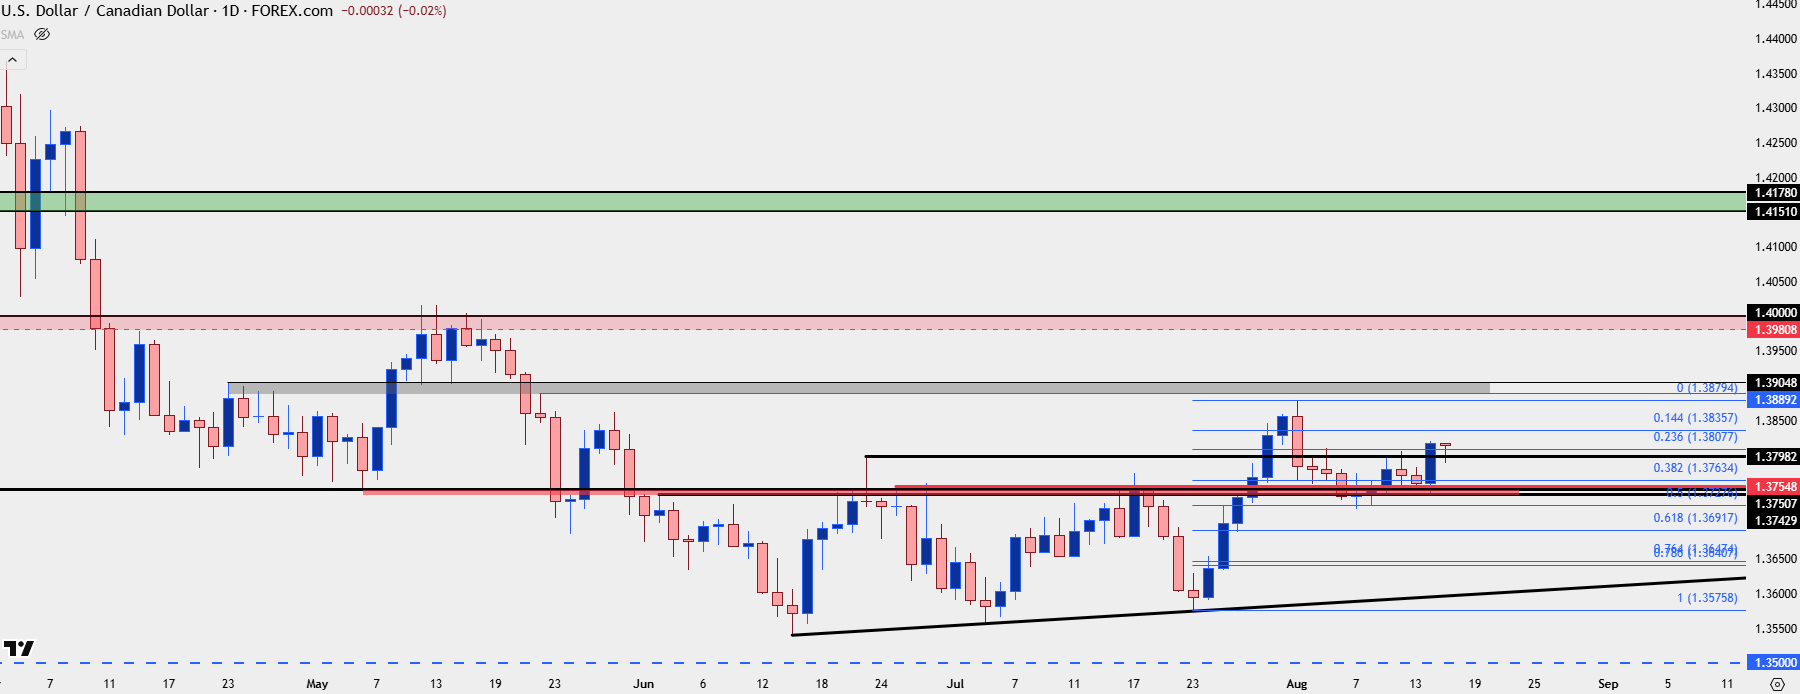
Chart prepared by James Stanley; data derived from Tradingview
USD/JPY
It’s been getting more and more quiet in USD/JPY following the breakout/snapback episode from late-July and early-August. But, notably, sellers had an open door to make a move this week and failed, with the same 146.95 support level coming into hold daily lows on Thursday and Friday.
I think that USD/JPY has a massive impact on larger macro flows around the USD and so far, the pair has remained supported at higher-lows, currently by about 700 pips above the April lows, even as the USD trades below it’s prior April low. If we see USD-strength around Jackson Hole then USD/JPY could come in as attractive again.
USD/JPY Daily Price Chart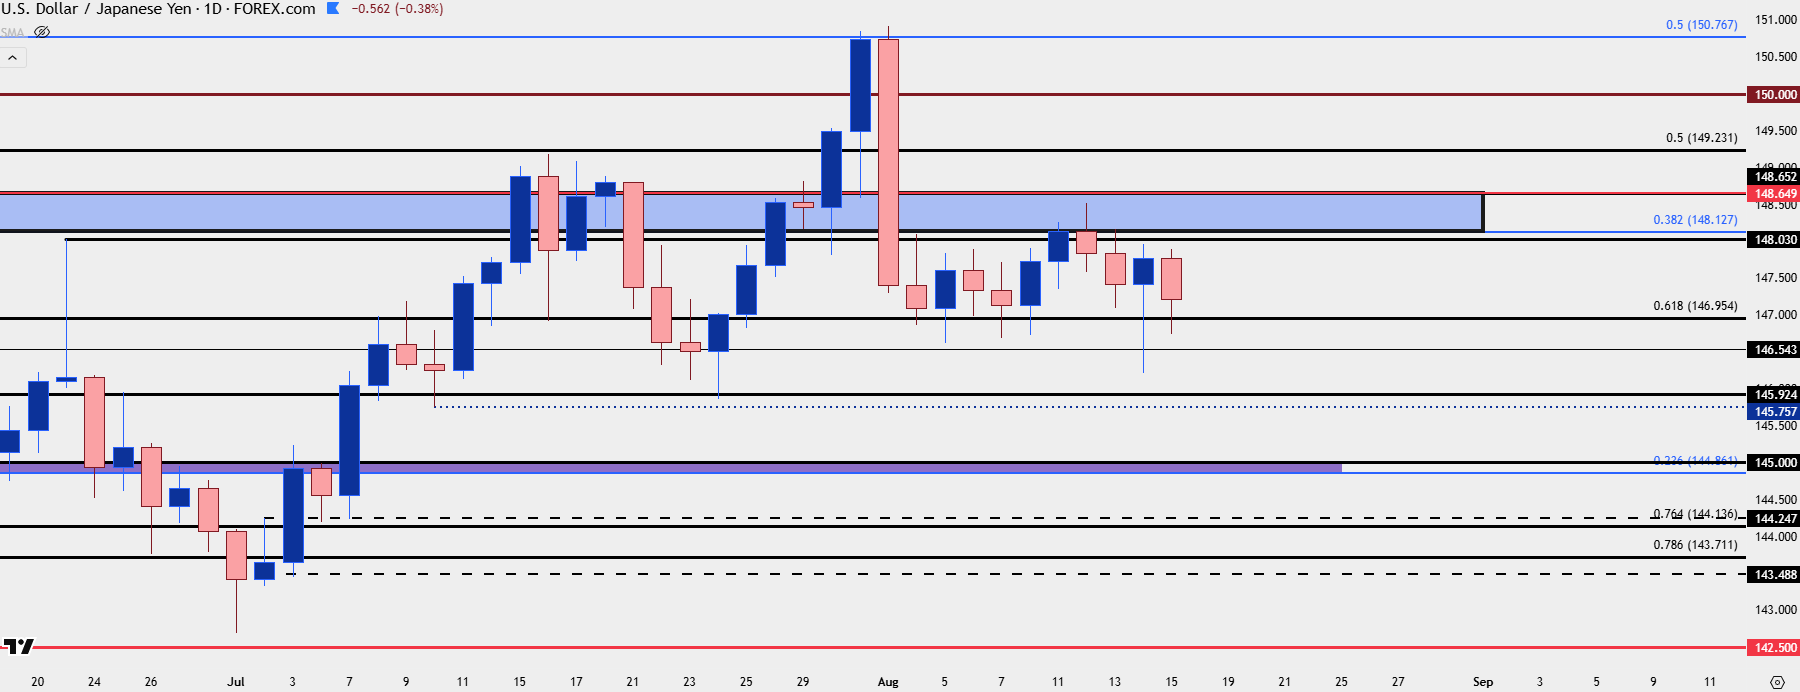
Chart prepared by James Stanley; data derived from Tradingview
— written by James Stanley, Senior Strategist