Post-CPI USD Price Action Setups: EUR/USD, GBP/USD
August 12, 2025 21:52USD Talking Points:
- It was a choose your own adventure story in this morning’s CPI data with Core CPI climbing back-above 3% to print at 3.1%, above expectations, while headline CPI came in below the expectation at 2.7%.
- The response in the USD was clear as Dollar-weakness took over and DXY is now down for a re-test of the 98.00 handle.
- The big question now is whether sellers can break the higher-low and higher-high structure that’s built in the USD in the first half of Q3 trade.
- This is an archived webinar and you’re welcome to join the next one live. Click here to register.
This morning’s CPI data had a little something for everyone. For USD bulls there was the Core CPI beat of the 3% expectation as the data came in at 3.1%. This argues that rate cuts from the Fed aren’t necessarily of dire need as inflation has continued to go up even without the Fed loosening policy, and the unemployment rate has remained at 4.2% which as Chair Powell opined is near full employment. On the other side, however, headline CPI came in at the same 2.7% as last month, and inside of the 2.8% expectation.
The response from markets has been clear as odds for a cut at the Fed’s next meeting in September have jumped up to 94.4%, as of this writing, and the USD has fallen in response. DXY is now re-testing the same 98.00 level that was in-play last week and that was the same level that was showing as support back in April for the US Dollar.
US Dollar Daily Price Chart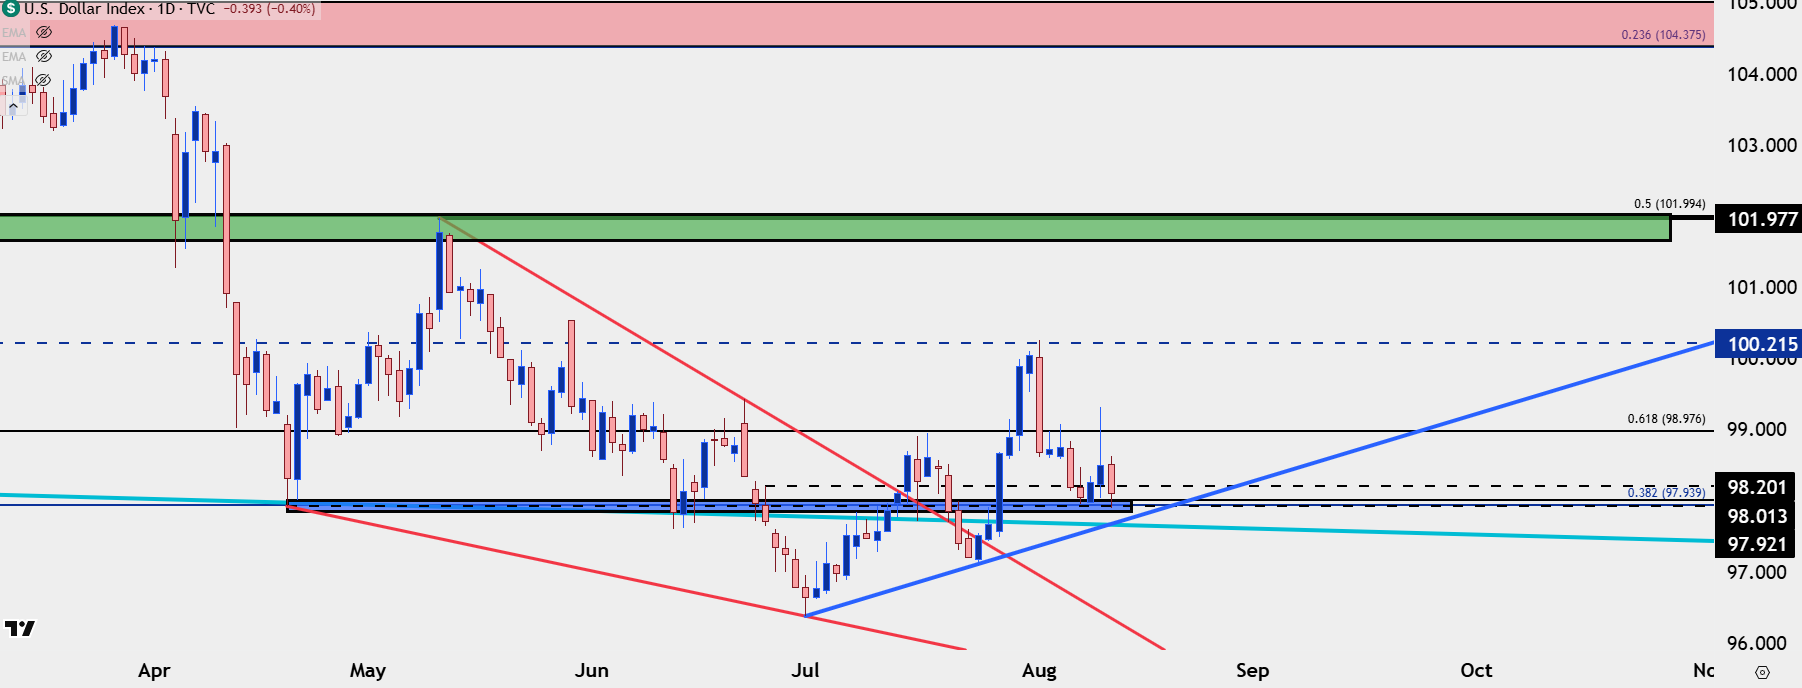
Chart prepared by James Stanley; data derived from Tradingview
USD Shorter-Term
The question now is whether USD bears can stretch down to a fresh low, which has been an evasive topic so far in Q3 trade. Last month after CPI, the USD broke out, and that’s when I highlighted that President Trump could threaten Jerome Powell’s job atop the Fed as a way to bring in USD-weakness. That happened less than 24 hours later and in response the USD gave back much of that CPI-fueled breakout. But – USD bears couldn’t a fresh low and that led into a rally that ran through the July close.
That allowed the USD to finish its strongest month in more than three years, which helps to illustrate just how oversold the currency had become into the Q3 open.
USD Four-Hour Price Chart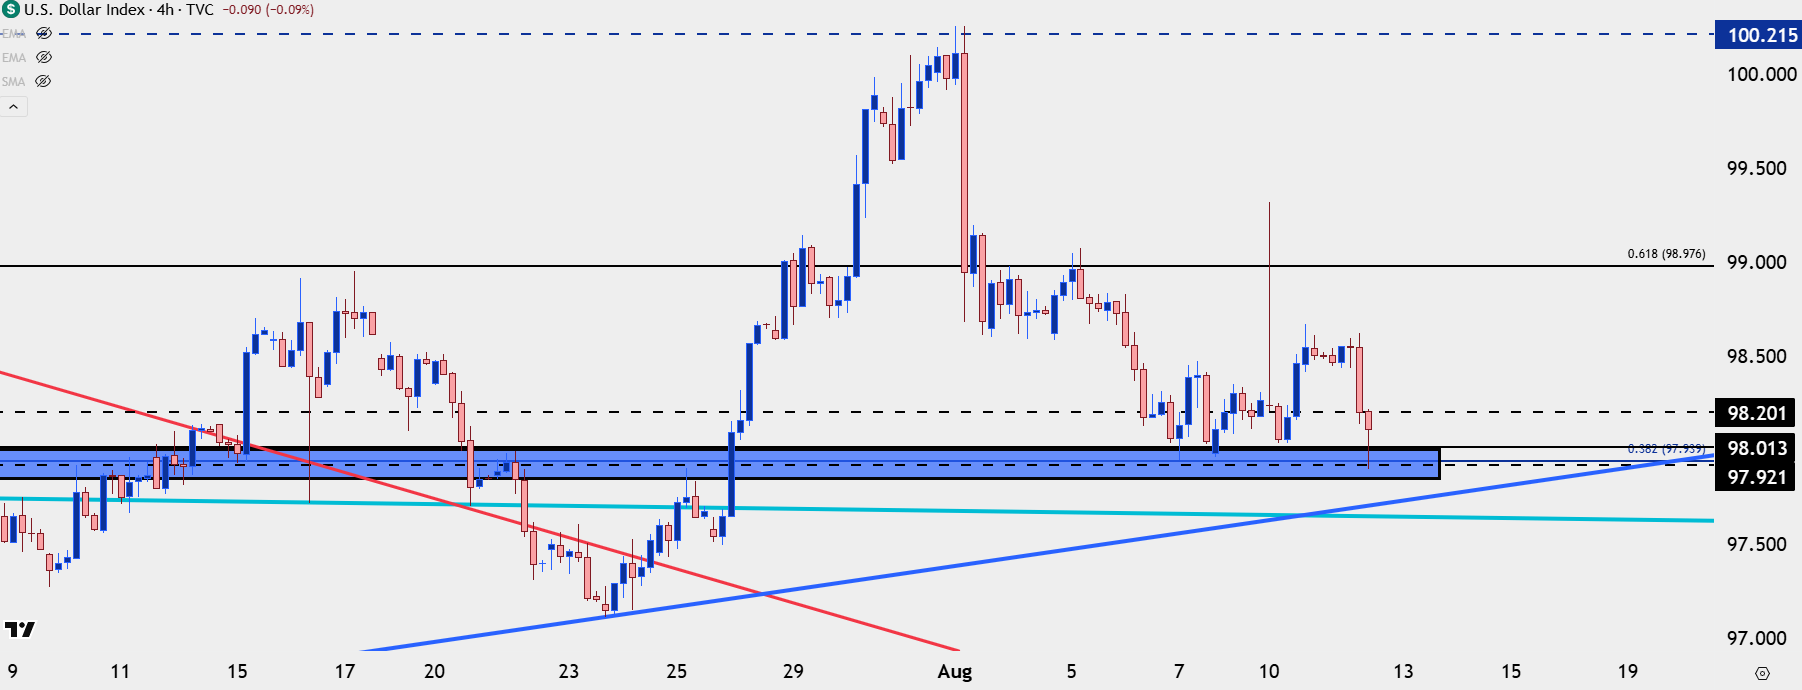
Chart prepared by James Stanley; data derived from Tradingview
EUR/USD Back to Resistance
On a short-term basis EUR/USD has retained bullish structure following the support test at the 1.1593 level yesterday, which was a prior point of resistance.
But now the pair is back up for a test of a longer-term Fibonacci level at 1.1686. Above that, another Fibonacci level of note plots at 1.1748, and on a bigger picture basis, a hold at either can keep the door open for lower-low and lower-high construction, which would seem an important component of the bullish scenario for USD above.
EUR/USD Four-Hour Chart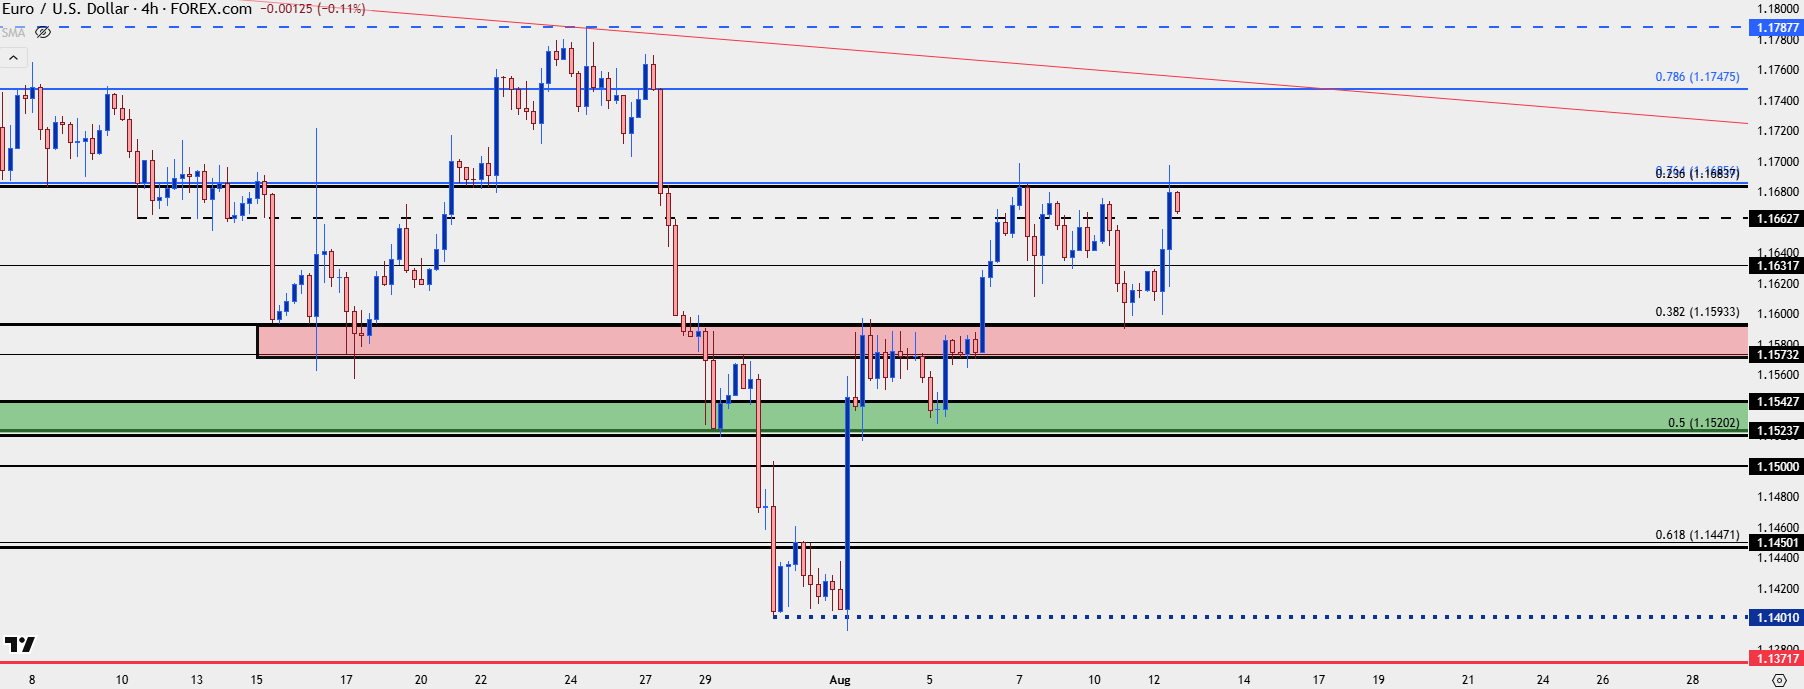
Chart prepared by James Stanley; data derived from Tradingview
EUR/USD Bigger Picture
For the longer-term setup the big question here is that lower-low and high structure that’s built in the first half of Q3. Below we can see the prior swing high at 1.1788 and there’s a trendline projection that aligns with the 1.1750 area, around that deeper Fibonacci level later this week or early next week.
EUR/USD Daily Chart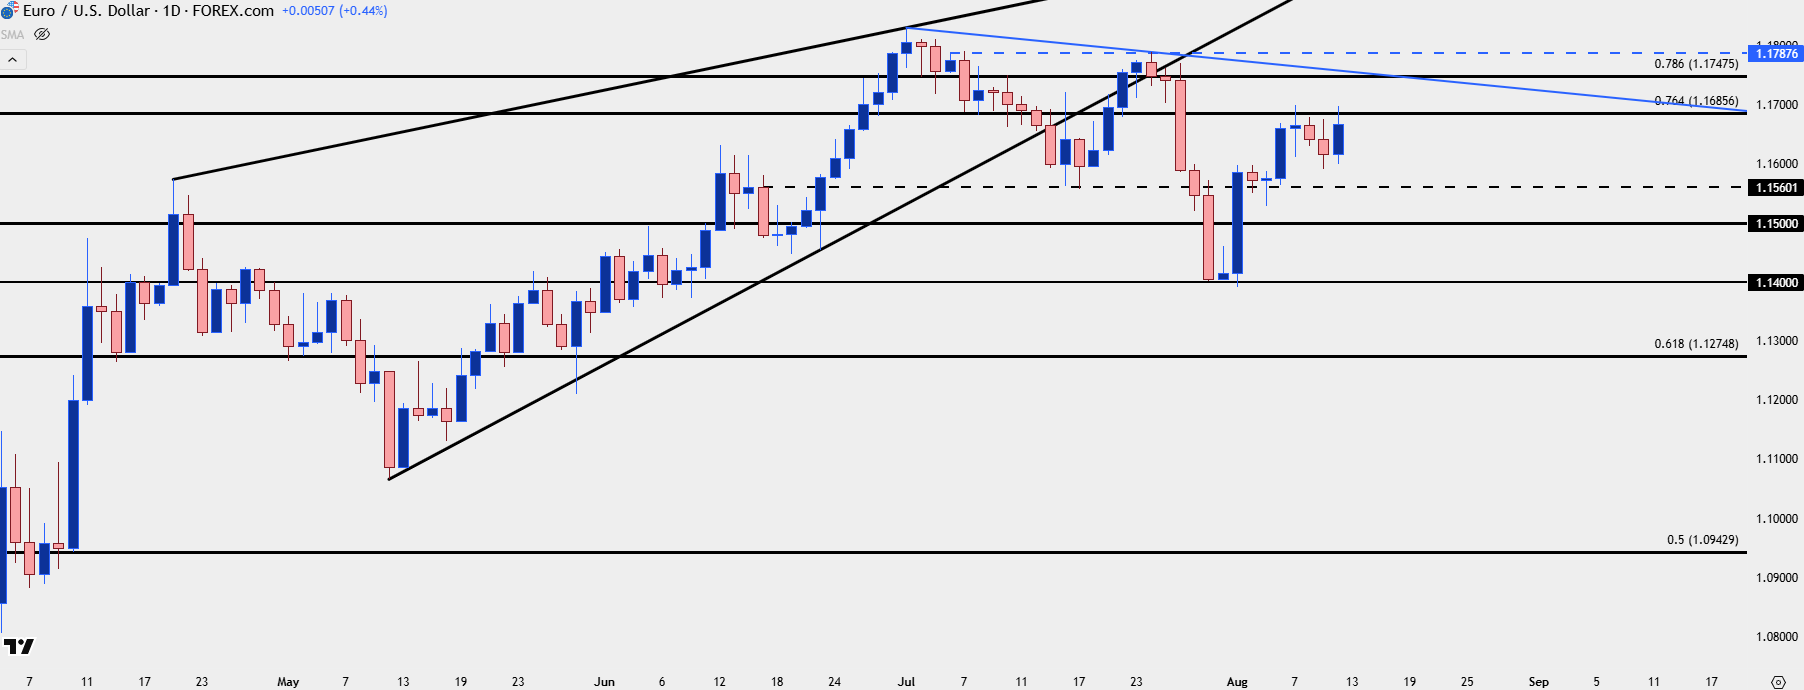
Chart prepared by James Stanley; data derived from Tradingview
GBP/USD
GBP/USD remains one of the more attractive venues for USD-weakness to continue. There was a strong reaction to the 1.3395-1.13414 zone last month around that Trump threat to fire Powell. As USD strength came back around the Fed and PCE report in late-July, GBP/USD perched all the way down for a re-test of the May low at 1.3145. Since then, however, bulls have been on the way back, pushing a rally even through last week’s BoE rate cut.
The pair is now re-tangling with the 1.3500 level and the 1.3395-1.3414 zone has come back in as support. There’s now reference for support at 1.3462 and then the topside of the zone down to around 1.3414 is of interest.
GBP/USD Four-Hour Price Chart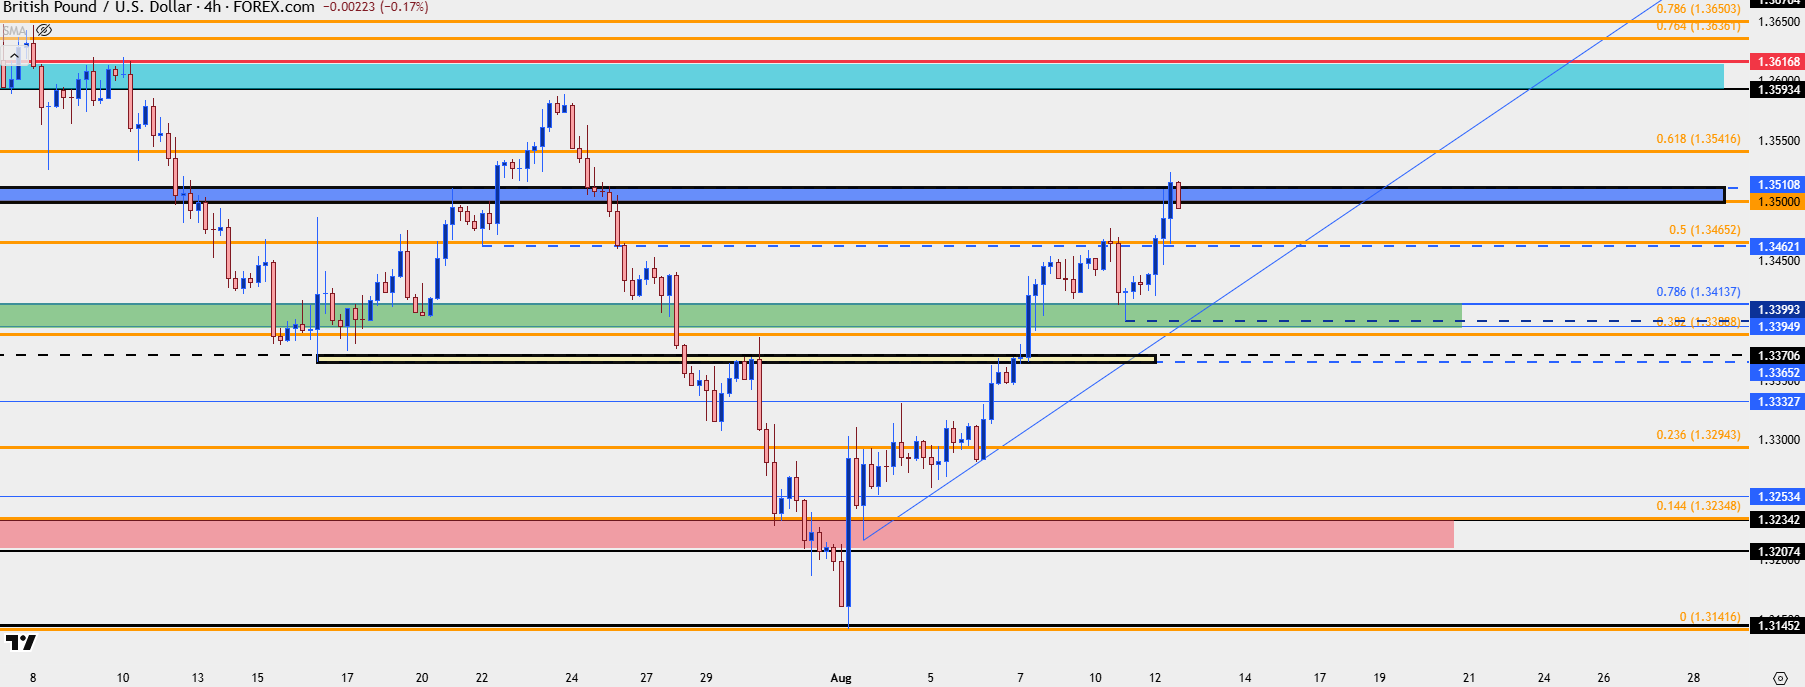
Chart prepared by James Stanley; data derived from Tradingview
— written by James Stanley, Senior Strategist