Nasdaq, Gold Forecast: Trump Tariffs and NFP Risks
August 1, 2025 12:49Key Events
- Nasdaq drops nearly 700 points back to 23,000 on Trump tariff and tech supply disruption risks
- Gold holds ground near 3270 on the possible re-emergence of haven appetite due to Trump tariffs and daily overbought momentum on the dollar
- Dollar rebound tests 100.20 resistance ahead of NFP report volatility risk
Following a decline in Fed rate cut expectations for the year, as indicated by the CME FedWatch Tool, and in tandem with renewed tariff threats and risks to tech input costs and global supply chains—with rates ranging between 10% and 41%—the Nasdaq pulled back more than 700 points from its recent peak at 23,700. The US Dollar held below the 100.20 resistance, potentially supporting gold prices and haven demand above the 3,270 support level.
Tariff-related risks continued to weigh on the technology sector, despite a series of stronger-than-expected earnings reports delivered between Wednesday and Thursday by Meta, Microsoft, Amazon, and Apple.
While Trump’s tariffs are delayed until August 7 and target 92 countries, including the European Union, market focus remains on sensitive sectors such as electronics, semiconductors, and critical minerals—particularly from Taiwan, South Korea, and India. The escalation of tariffs in these high-risk sectors has amplified concerns over supply chain fragility and rising production costs.
Despite preliminary trade agreements with partners like the EU, UK, Japan, and Vietnam, risks of retaliatory measures—especially from the EU—have dampened overall sentiment. This unfolds against the backdrop of Powell’s persistent concerns over inflation, placing heightened emphasis on today’s NFP report as a potential trigger to either reinforce or shift the current market narrative.
Will risk appetite shift again from stocks toward havens until trade agreements reach a fair market consensus?
Technical Analysis: Quantifying Uncertainties
Nasdaq Forecast: Daily Time Frame – Log Scale
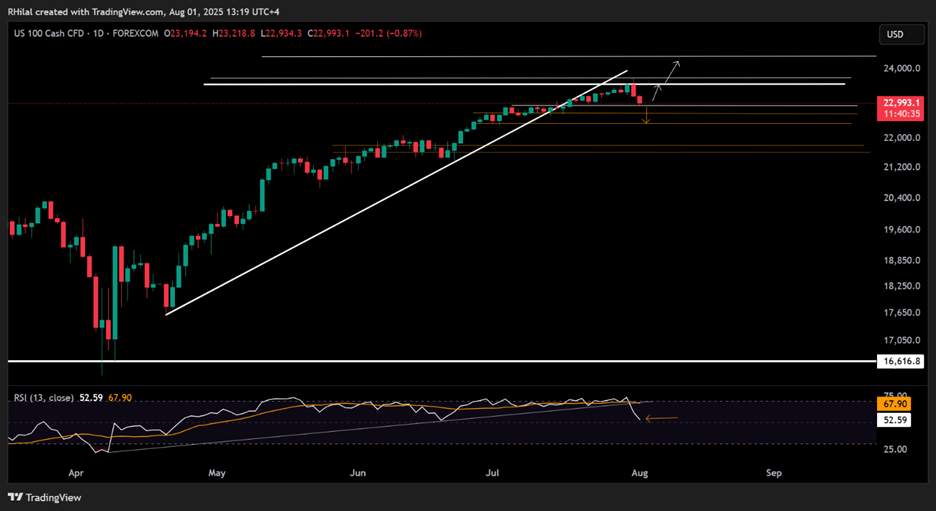
Source: Tradingview
As highlighted in my earlier Nasdaq analysis, the 23,500 level has remained a dominant resistance for the trend, evident from recent price closes and opens around that zone—a key level that coincides with the 0.618 Fibonacci extension drawn from: October 2022 low (10,432), February 2025 high (22,245), and 2025 trough (16,324)
Bullish Scenario:
A sustained close above 23,500 may extend the rally toward 24,300 and the 25,500–25,600 zone.
Bearish/Neutral Scenario:
Given the latest drop toward the 22,900 support, failure to hold above this level could trigger a deeper correction toward 22,700, 22,400, and 22,170 before resuming the broader uptrend—or possibly confirming a deeper downturn into H2 2025.
Gold Forecast: Daily Time Frame – Log Scale
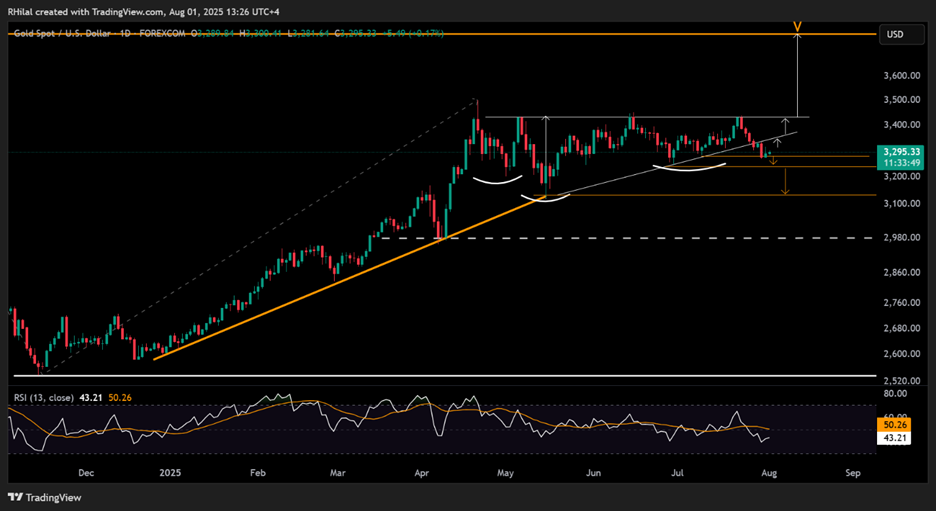
Source: Tradingview
In line with a possible shift in market sentiment, Gold is holding above the 3260 support level, maintaining an extended consolidation range—since April 2025—below the key resistance zones at 3340 and 3440.
A confirmed breakout above this range could lead to new record highs at 3780 and 4000.
However, a clear break below 3240 could trigger a steeper decline toward the 3130 level.
Written by Razan Hilal, CMT
Follow on X:@Rh_waves