Gold technical analysis August 18, 2025
August 18, 2025 18:19Gold kicked off the week on a steadier footing, recovering losses from Friday’s drop during Asian trade, before erasing those gains by later European trade. The metal slipped 1.8% last week, ending a two-week winning streak, yet prices are still hovering within familiar ranges. In truth, the past three months have seen gold drift sideways, unable to build momentum in either direction. Profit-taking has capped further gains, but ongoing central bank demand, a softer US dollar, and its safe-haven status amid trade disputes and the Ukraine conflict continue to underpin prices near record highs. With the short-term picture lacking clear direction, it may be wiser to step back and assess the longer-term gold technical analysis in trying to determine which direction prices are most likely headed.
Long-term gold technical analysis
Gold’s longer-term trend has been extraordinary, with repeated highs and only brief pauses. The pressing question now is whether this rally still room has to run, or if the market is finally primed for a correction. Momentum indicators have been flashing warnings for a while now, with some monthly candles looking uncomfortably bearish—though crucially, without any follow-through just yet.
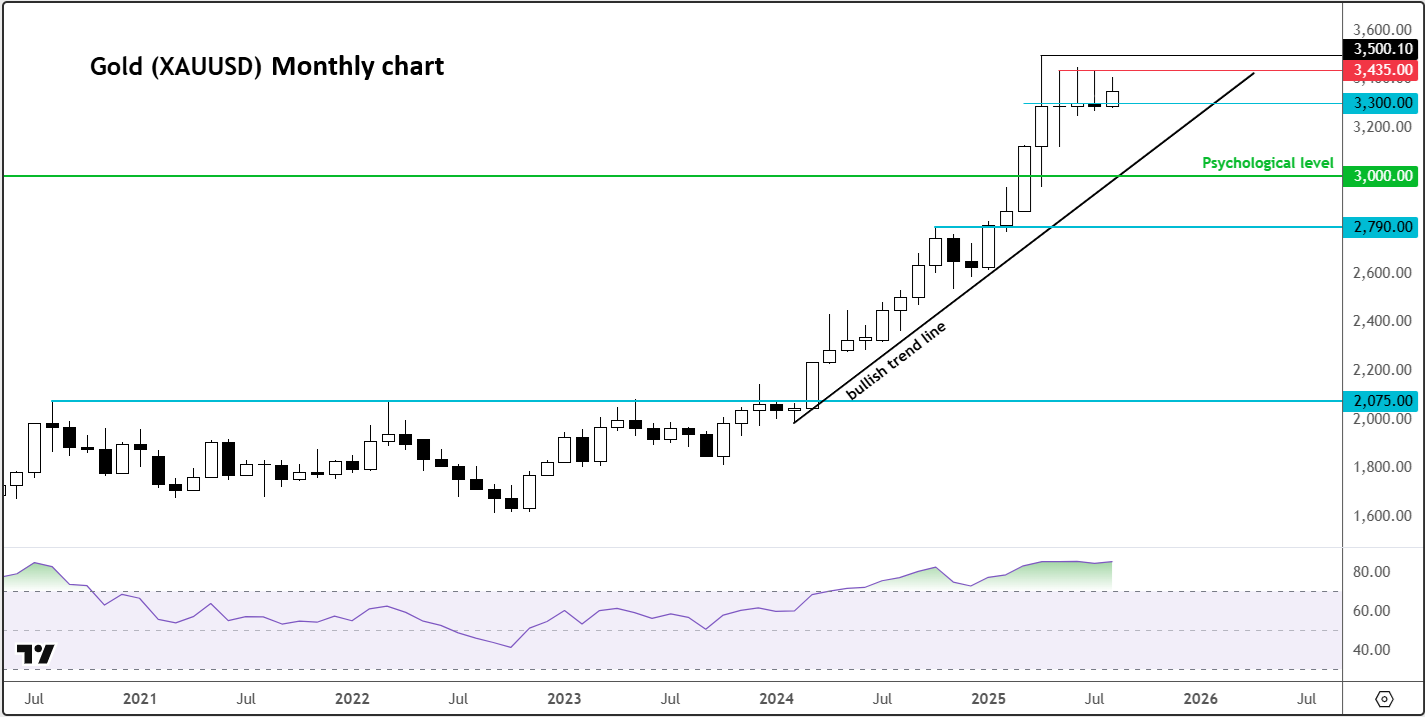
In fact, the last three months have produced doji-style candles on the monthly gold chart, often associated with market tops. A decisive break and close below $3,300 would serve as a strong warning signal for traders.
Adding to this, the monthly Relative Strength Index (RSI) has been in overbought territory since April 2024 and now sits above 85, a level not seen since the pandemic rally. The only other comparison in recent memory is 2011, which marked a significant top. Historically, whenever RSI climbs past 80, it tends to precede either a lengthy consolidation or a sharper pullback.
Weekly perspective more supportive
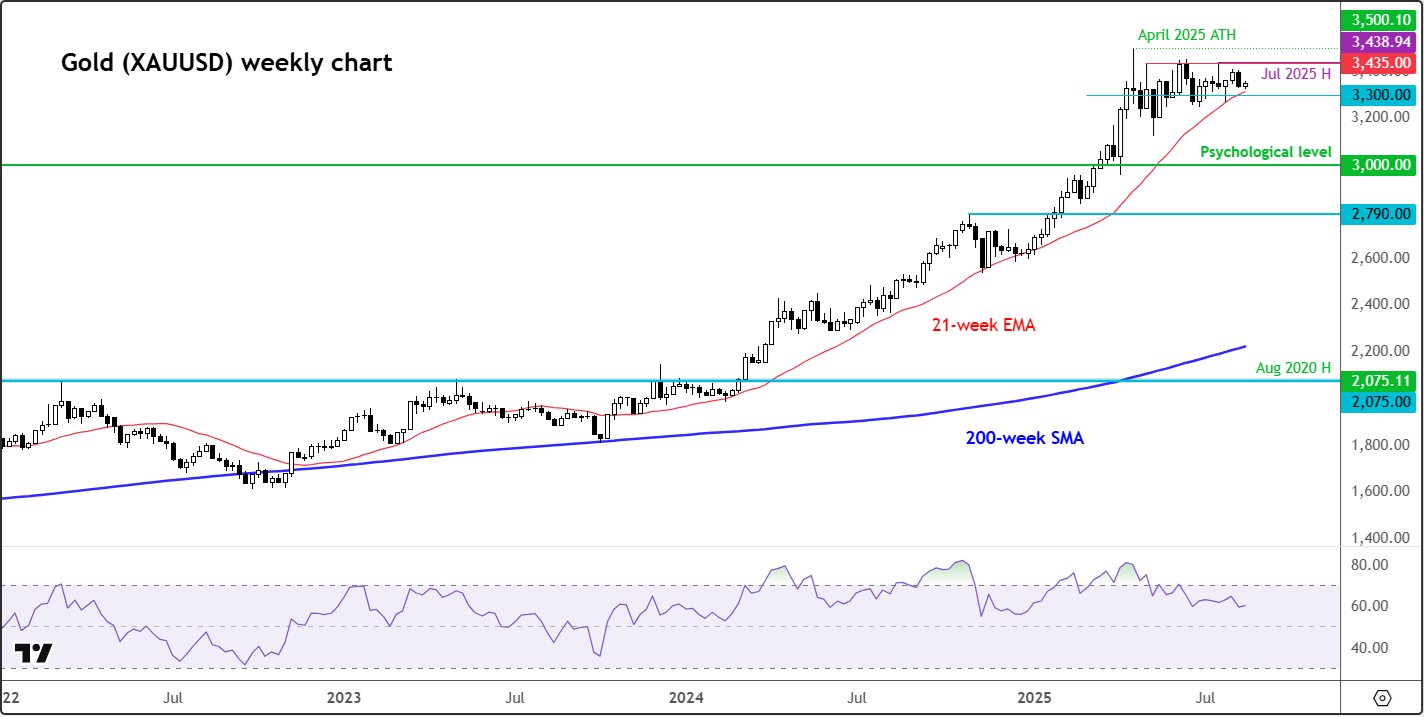
The weekly chart paints a slightly more forgiving picture. Since peaking in April, RSI has cooled from around 80 to 60, not by a sell-off, but through consolidation—a far more bullish signal. Importantly, prices remain well above the 200-week moving average, currently sitting near $2,200, close to the long-term breakout zone around $2,070–$2,075. For prices to reconnect with that level, gold would need to give up nearly a third of its value—an unlikely outcome. More realistically, the moving average may simply catch up as gold consolidates before its next leg higher, which remains my base case.
Gold technical analysis: ley levels to watch
- Near-term support stands at $3,300, followed by $3,100 at the rising trend line, and the key $3,000 psychological level.
- Resistance remains firm at $3,435, with April’s peak at $3,500 the next major hurdle.
In short, our gold technical analysis suggests the metal remains delicately balanced. While haven demand may have plateaued for now, persistent central bank buying and ongoing weakness in US dollar could keep the bulls engaged. For now, I’m leaning towards buying dips—albeit with caution, given the stretched nature of the technicals.
— Written by Fawad Razaqzada, Market Analyst
Follow Fawad on Twitter @Trader_F_R