Gold Short-term Outlook: XAU/USD Pressures Key Support Level
July 8, 2025 18:43Gold Technical Outlook: XAU/USD Short-term Trade Levels
- Gold prices under pressure– bears threaten break of yearly uptrend
- XAU/USD weekly / monthly range set below resistance- breakout imminent
- Resistance 3355/80 (key), 3432, 3500- Support 3289-3302, 3240/46 (key), 3132
Gold prices are under pressure early in the week with XAU/USD threatening to break the 2025 uptrend. The immediate focus is on a breakout of the monthly opening-rang with the bulls vulnerable while below the record high-day close. Battle lines drawn on the XAU/USD short-term technical charts.
Review my latest Weekly Strategy Webinar for an in-depth breakdown of this gold technical setup and more. Join live on Monday’s at 8:30am EST.
Gold Price Chart – XAU/USD Daily
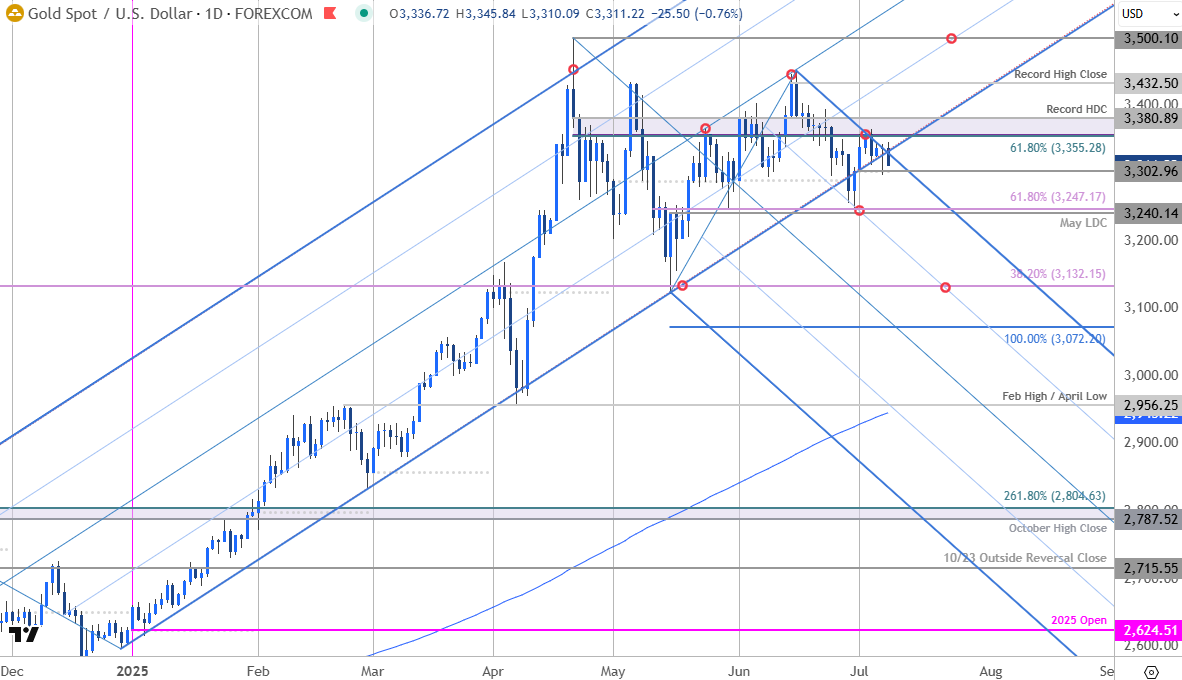
Chart Prepared by Michael Boutros, Sr. Technical Strategist; XAU/USD on TradingView
Technical Outlook: In last month’s Gold Short-term Outlook we noted that the XAU/USD rally had, “extended into uptrend resistance at the median-line- risk for possible inflection / topside exhaustion into this slope. From a trading standpoint, losses should be limited to 3355 IF price is heading for a breakout…” Price reversed the following day with gold plunging nearly 5.9% off the June high. A rebound into the July open failed at former support near 3355 last week with the bears now threatening a break of the yearly uptrend- watch today’s close.
Gold Price Chart – XAU/USD 240min
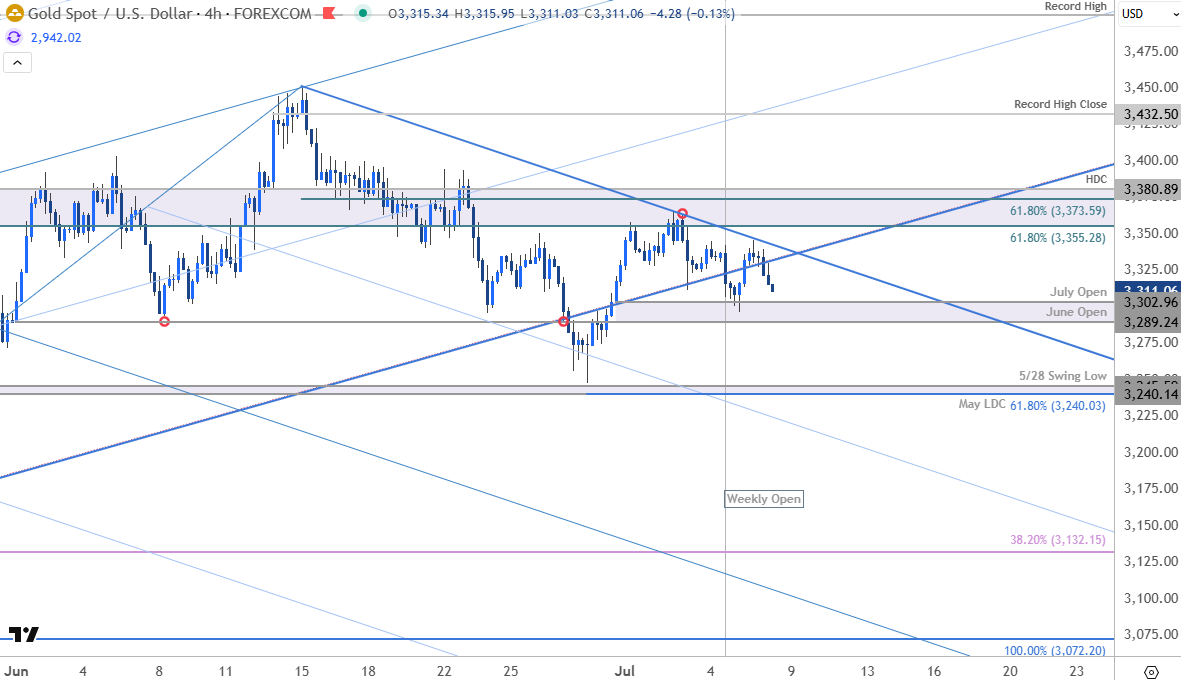
Chart Prepared by Michael Boutros, Sr. Technical Strategist; XAU/USD on TradingView
Notes: A closer look at gold price action shows XAU/USD trading within the confines of a descending pitchfork extending of the yearly highs with the weekly opening-range taking shape just below slope resistance. Initial support rests with the June / July opens at 3289-3303 and is backed by 3240/46- a region defined by the May low-day reversal close (LDC) and the 61.8% extension of the June decline, and the 5/28 swing low. A break / close below this threshold would be needed to invalidate the yearly uptrend / suggest a larger correction is underway toward 3132 and the 100% extension of the April decline at 3072– both levels of interest for possible downside exhaustion / price inflection IF reached.
Resistance stands at 3355/80– a region defined by the 61.8% retracement of the April decline, the 61.8% retracement of the June decline and the record high-day close (HDC). A breach / daily close above this pivot zone is needed to mark uptrend resumption with subsequent resistance objectives unchanged at the record high close at 3432 and the record high at 3500.

Bottom line: Gold is poised for a breakout of the weekly / monthly opening-range with the long-bias vulnerable while below the yearly high-day close. From a trading standpoint, rallies should be limited to 3380 IF price is heading lower on this stretch with a close below 3240 needed to suggest a larger reversal is underway. Be on the lookout for a potential exhaustion low closer to the lower parallels if the bears break through. Review my latest Gold Weekly Technical Forecast for a closer look at the longer-term XAU/USD trade levels.
Key Economic Data Releases
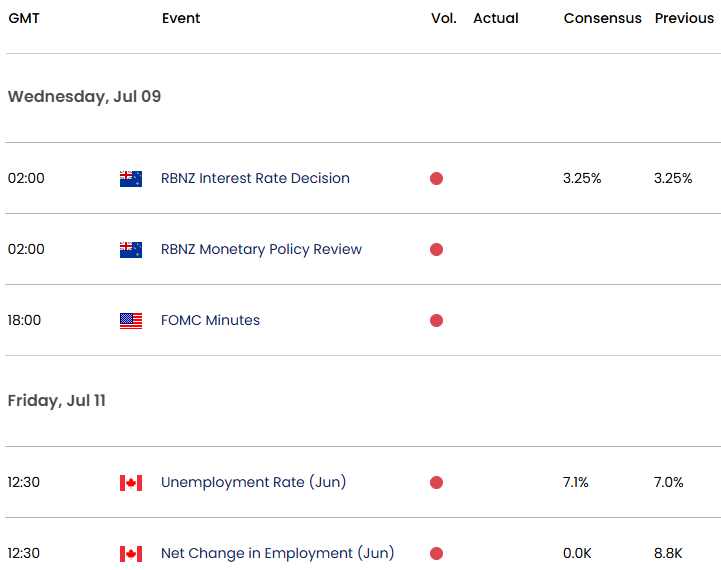
Economic Calendar – latest economic developments and upcoming event risk.
Active Short-term Technical Charts
- Canadian Dollar Short-term Outlook: USD/CAD Grinds at Support
- US Dollar Short-term Outlook: USD Set to Snap 7-Day Slide Before NFP
- British Pound Short-term Outlook: GBP/USD Surges into Resistance
- Euro Short-term Outlook: EUR/USD Slips Toward Trend Support
- Swiss Franc Short-term Outlook: USD/CHF Support Intact Ahead of Fed, SNB
- Japanese Yen Short-term Outlook: USD/JPY Breakout Looms Ahead of Fed
- Australian Dollar Short-term Outlook: AUD/USD Poised for Breakout
— Written by Michael Boutros, Sr Technical Strategist with FOREX.com
Follow Michael on X @MBForex