Gold Futures Outlook: Technical Triangle Meets COT Pressure
August 6, 2025 02:58Gold Futures (GC) continue to consolidate beneath record highs, with technical and sentiment signals pointing to a potential shift in momentum. The weekly chart reveals a developing symmetrical triangle, hinting at a bullish continuation—but the timing remains uncertain. Meanwhile, large speculators slashed nearly 50,000 contracts in net-long exposure last week, according to COT data, despite a short-term rally. That divergence suggests gold may face resistance near $3500 before any upside breakout can materialise.
View related analysis:
- Gold Rally Stalls Below Monthly High: Is a Deeper Pullback Brewing?
- Gold Rally Faces Resistance Heading Into July
- Dow Jones Futures (YM) Outlook: August Seasonality and Key Levels
- GBP/USD Flips to Net Short, Yen and Gold Bulls Retreat: COT report
Gold Price Faces Key Resistance as Speculators Exit Longs
Gold Futures (GC) Technical Analysis: Weekly Chart
The weekly chart shows that gold futures remain in a well-established uptrend, although price action has been choppy since the record high in April. Prices have yet to reclaim the shooting star reversal high at 3594.6, and have since formed a series of higher lows—each marked by bearish patterns such as a dark-cloud cover and another shooting star
This evolving structure hints at a symmetrical triangle, which may resolve with a bullish breakout in line with the dominant trend. However, timing remains uncertain, and a breakout is not yet confirmed. The triangle projects an upside target around $3900 if successful.
For now, prices continue to oscillate around the high-volume node (HVN) near 3400, which tends to favour range traders—either fading into rallies or buying dips. With the weekly RSI (2) approaching overbought levels, there may be limited upside for gold bulls in the near term.
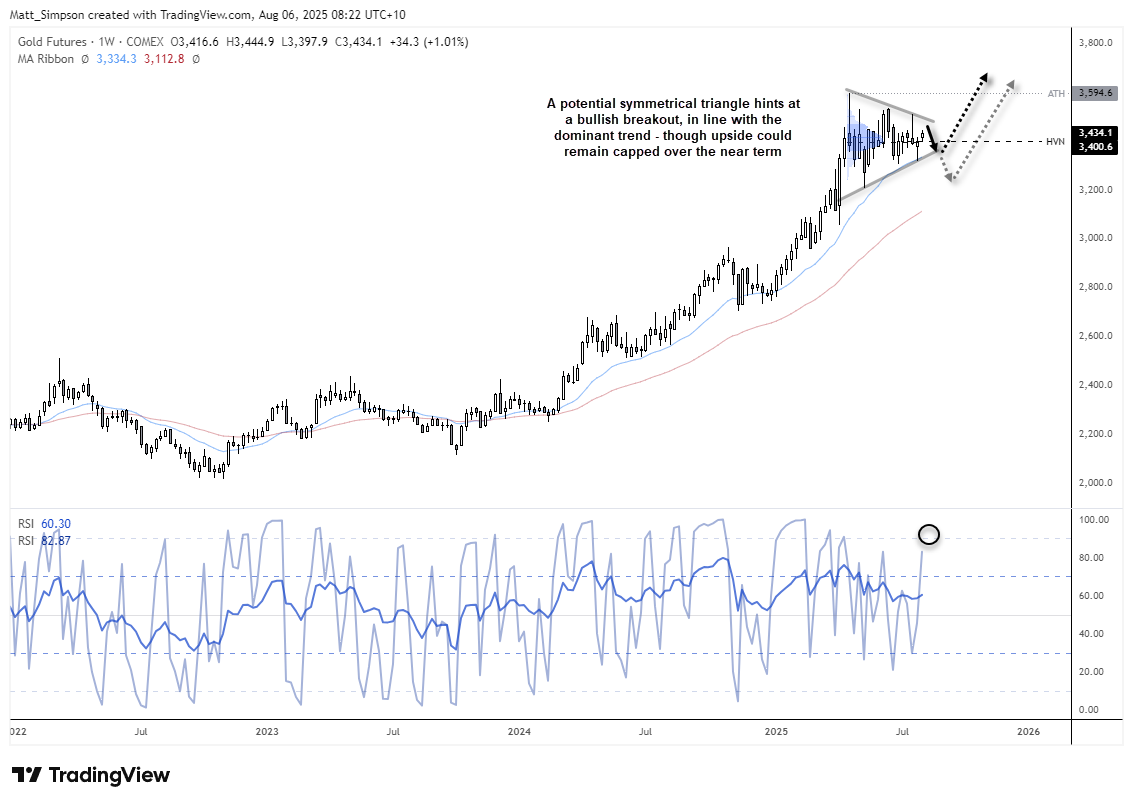
Chart analysis by Matt Simpson, Source: TradingView, COMES Futures, Gold

Gold Futures (GC) Technical Analysis: Daily Chart
Gold futures rose for a fourth consecutive day on Tuesday, although bullish momentum appears to be waning, with two consecutive doji candles forming near resistance.
Importantly, price has repeatedly struggled around the $3500 region, with three clear two-bar bearish reversal patterns forming at or just below that level. Now, with RSI (2) curling lower from overbought territory, the setup suggests a potential swing high may be developing on the daily chart.
- Bears could look to fade into moves within the 3447–3500 range while price remains below the 3508.9 high.
- The 100-day EMA (3322.4) and July low (3319.2) offer potential downside targets over the near term.
- A break below the June low (3307.7) opens the door for a deeper move toward the May low (3208.0).
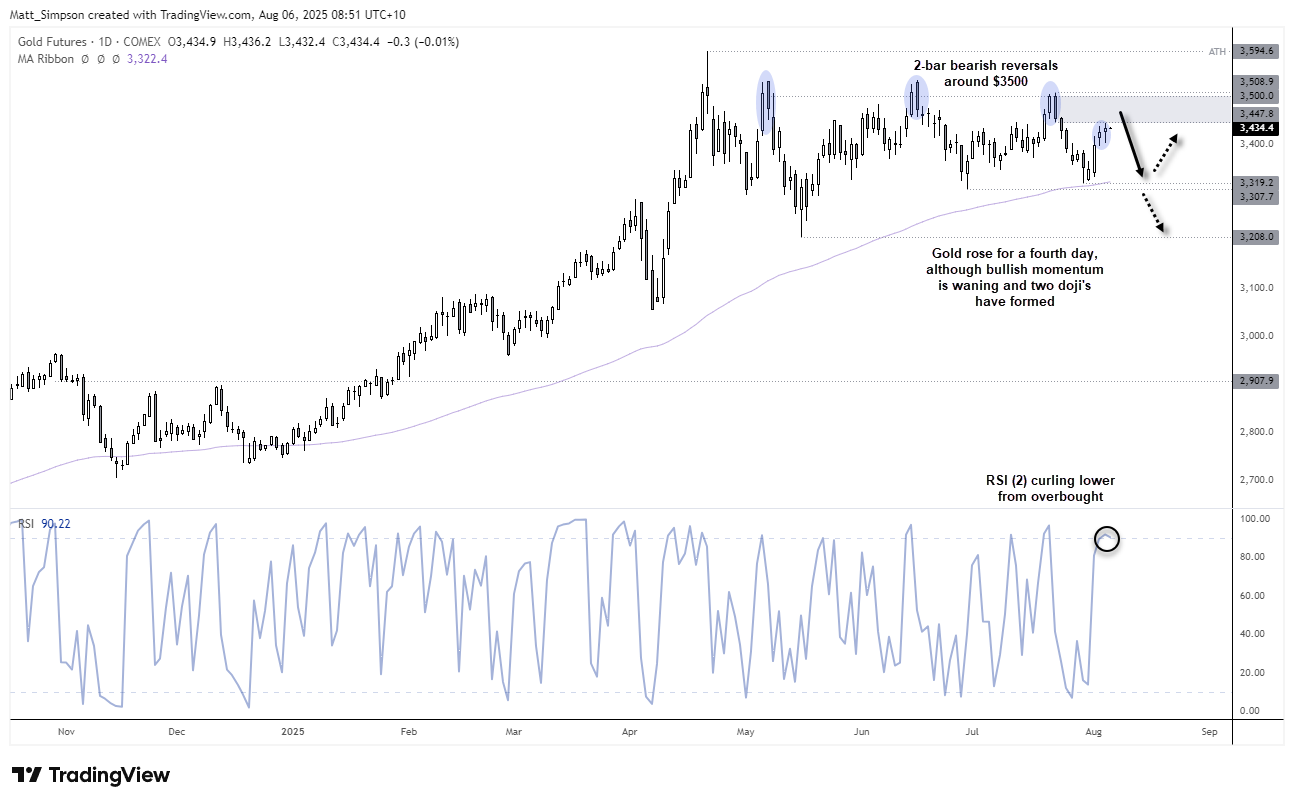
Chart analysis by Matt Simpson, Source: TradingView, COMEX Futures, Gold
Gold Futures Positioning (GC): Weekly COT Report Analysis
Large speculators reduced their net-long exposure to gold futures by -29.4k contracts, their most aggressive reduction in 16 weeks. Though the move was mostly fuelled by a reduction of gross-longs, which fell by -30.7k contracts (-9.8%). Gross-shorts were marginally lower by -1.3k contracts (-2.1%).
Asset managers reduced net-long exposure to gold futures by -25.6k contracts last week, taking the total between the two sets of trades to around -50k contracts. They also reduced gross longs by -23.8k contracts (-12.2%) and increased shorts by 1.8k contracts (5.3%).
While gold prices have since achieved a 4-day winning streak, I remain doubtful that the 50k net-long exposure erased last week ahs been recouped. And that backs up my bias that gold gains could be limited over the near term, and vulnerable to a pullback on the daily timeframe.
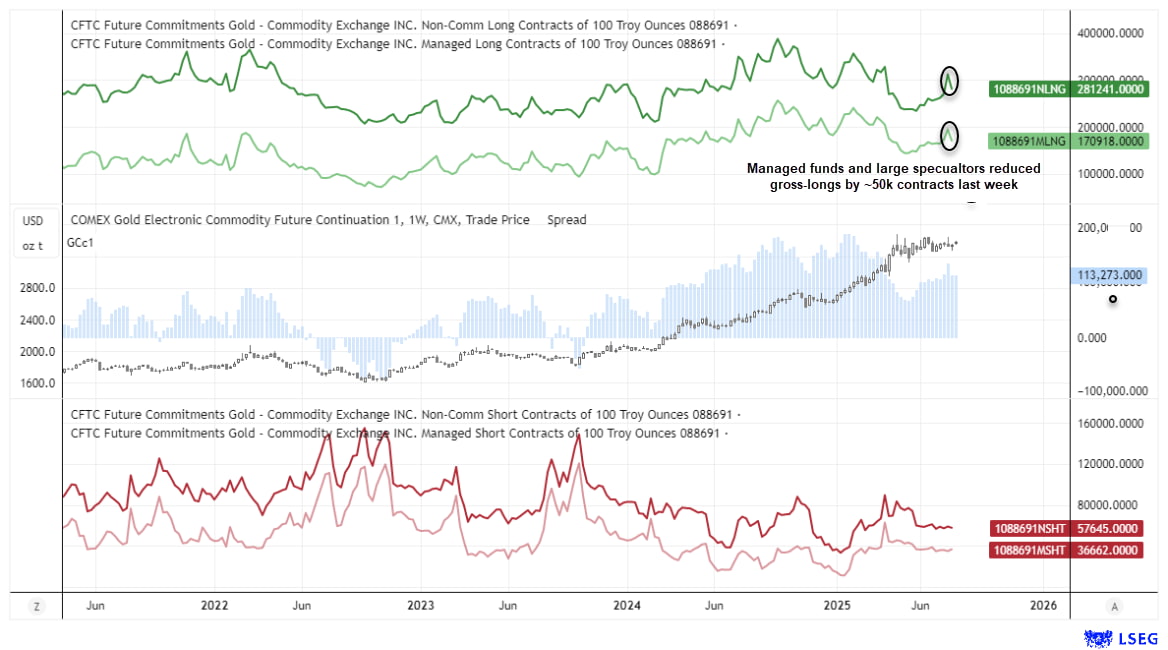
Chart analysis by Matt Simpson, Source: LSEG, COMEX Futures
View the full economic calendar
— Written by Matt Simpson
Follow Matt on Twitter @cLeverEdge