Gold forecast H2 2025: Don’t expect repeat of first half
July 1, 2025 14:22- Gold forecast: XAU/USD record run in H1 may give way to consolidation in H2
- Central bank purchases still underpin prices, but haven demand may cool
- US trade policy and equity volatility remain key drivers for gold
Gold’s extraordinary rally that pushed prices beyond $3,000 in mid-March continued in early Q2, capping off an incredible first half of 2025 in which gold rose a solid 25%. The metal has now risen in 6 out of the last 7 quarters, making an eye-catching 77% return over this period. But after a parabolic-like move, some momentum slowdown was always on the cards. Indeed, after the initial rally to a record $3,500 in April, the metal then spent much of the rest of Q2 digesting gains as prices remained near record highs, albeit with increasing signs of fatigue. As we move into the second half of 2025, the question isn’t whether gold’s long-term uptrend remains intact—it does—but whether the pace of gains can continue. With gold deeply overbought earlier in the year, continued consolidation now appears both healthy and necessary. Even a correction should not come as surprise in H2, given the return of risk appetite with the S&P recovering all its losses from February and some. The increased risk appetite should mean lower haven demand, which may weigh on our prior bullish gold forecast.
Ballooning US debt shrugged off for now
Fundamentally, the mood has soured on US dollar and bonds through much of the first half of the year. The government’s failure to rein in soaring debt and deficits could eventually jolt the markets as a growing number of analysts are worried about the sustainability of US fiscal policy. It doesn’t help that trade frictions have come back in the spotlight this year, while an unfunded $4.5 trillion tax cut bill is on the way. With Moody’s forecasting a deficit nearing 9% of GDP by 2035, it’s hard to see full confidence returning to Treasuries market —especially when China is also reportedly pulling back on its holdings. However, with the S&P 500 back at record highs at the end of H1, this suggests that investors were not yet significantly concerned about this. But if the US suffers another credit rating downgrade, then things could get messy for risk assets. This scenario should boost the gold forecast.
Central bank demand still going strong
Another key driver of gold’s strength has been relentless central bank buying. Led by the People’s Bank of China, institutions around the world have continued to diversify away from the US dollar. Over the past three years, the World Gold Council estimates that central bank gold purchases have averaged over 1,000 tonnes annually—a trend not seen since the 1960s. The institution’s Central Bank Gold Reserves Survey released in June point to a continuation of the trend uncovered in previous years – namely, that central banks see gold making up a growing share of their reserve portfolios. According to the WGC figures, 76% of respondents believe that gold will hold a moderately or significantly higher share of total reserves five years from now, up from 69% last year.
Factors that could weigh on gold
With gold prices at unchartered territories without any major corrections, demand may cool down naturally – especially from central banks, which are value-conscious buyers. As prices remain elevated, their willingness to keep accumulating at this pace is likely to fade in H2. A moderation—not a reversal—of this trend could slightly cap the upside, especially if retail and ETF demand doesn’t pick up the slack.
Meanwhile, much of the focus is on demand, but let’s not forget supply. Shortage of platinum supply has been well documented this year, which has been a major driver behind its rally. But the same can’t be said of gold. Will rising prices encourage more production of the yellow metal? Is it easy to ramp up output for gold miners?
And let’s not forget gold substitutes and their impact on the gold forecast in H2 2025 and beyond. For example, with silver finally breaking out above $30, the white metal could outshine gold, reducing its appeal. What’s more, if we see a continuation of the rally in equities in H2, this could lessen the need for haven assets. And finally, gold investors may move to protect recent gains by investing in other assets, such as the racier Bitcoin and other cryptos. The fact that acceptance and relevance of crypto is now more, this lessens the need for holding gold.
What about safe haven demand in H2?
One of the strongest pillars of support for gold over the past few years has been safe-haven demand. From pandemic fears to inflation shocks and regional conflicts, the case for owning gold in uncertain times has been rock-solid. More recently, the return of Trump-era trade volatility has only helped to increase the metal’s appeal. His hawkish stance on China and unpredictable policy swings have all contributed to a sense of economic fragility.
Despite some easing in geopolitical tensions between Israel and Iran, wars in Ukraine and Gaza continued as we began H2, with investors remaining sceptical of a rapid resolution. Until then, gold remains the default hedge against miscalculation and escalation. That said, any surprise de-escalation or breakthrough in negotiations could dent gold demand at least temporarily – especially the war in Ukraine.
Technical gold forecast: key levels and factors to watch in H2 2025
Gold has been in a strong, long-term bullish trend, repeatedly hitting new highs with only modest pullbacks. The key question for H2 is whether this trend will continue. As traders, we prefer trading with the trend—unless there’s a clear reversal. That said, gold’s rapid ascent raises concerns about overvaluation. The Relative Strength Index (RSI) on the monthly chart remains deeply overbought, which will need to correct at some point—either through consolidation or a deeper pullback. We suspect this could happen in H2. While we still favour buying the dip, our outlook would turn bearish if a clear reversal pattern emerges.
The monthly RSI has been above 70 since April 2024 and now stands above 85—levels not seen since the COVID-19 rally, after which gold consolidated for over three years before breaking out in March 2024. The last time RSI was this high before that was in 2011, just before a major peak. Historically, when the monthly RSI crosses 80, it has often signalled a correction or at least a pause in the rally—making this an important warning sign on the long-term chart.
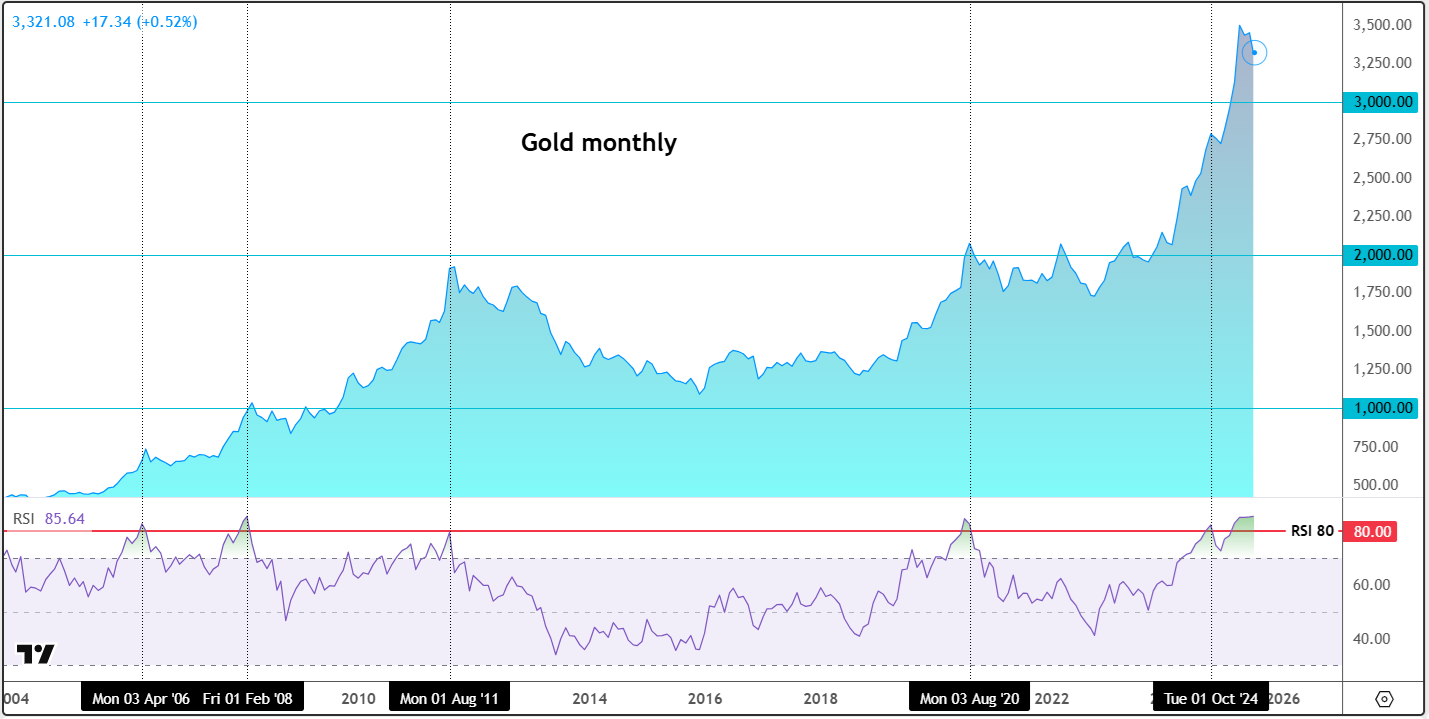
Source: TradingView.com
Zooming to the weekly chart, the RSI here started to make interim lower highs from extreme levels since the metal last hit an all-time high in April. The consolidation from that point on meant that gold’s weekly RSI went from a peak of around 80.0 to a low of around 63.00, which is still quite high but not as extreme as before.
The fact that the RSI on the weekly time frame unwound through consolidation than a sell-off, this is considered a bullish scenario on this time frame. The RSI on its own is not necessarily a “sell” signal, not until we see a corresponding reversal on the underlying gold prices.
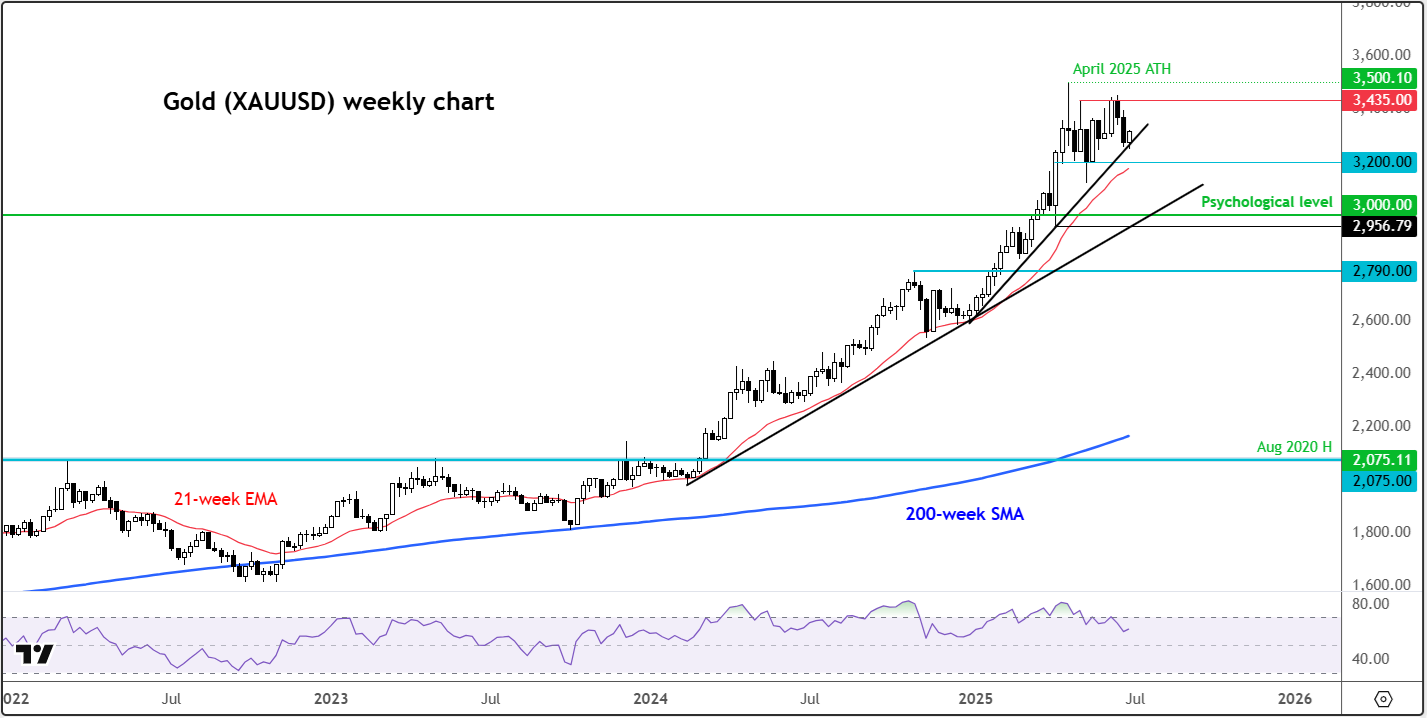
Source: TradingView.com
Another sign that gold may be overstretched is how far it’s trading above its long-term 200-week moving average—over $1,000 higher. That MA sits around $2160, near the long-term breakout area $2070–$2075. To put it in perspective, gold would need to drop about a third from current levels to reach the 200-week MA—unlikely, but not impossible. Of course, the moving average could catch up if gold consolidates near current highs for a while.
Given the strong uptrend, we favour looking for support around the faster 21-week EMA, which currently sits near $3170. Ahead of that, the 2025 trend line offers support around $3280–$3290.
There’s also the broader trend line from early 2024, which comes in around the key psychological $3,000–$3,100 zone. This is our line in the sand, as it marks a significant level.
If gold does weaken in H2, there are at least three major support areas where buyers may step in. But if prices break below the $3K trend line decisively, our technical outlook would turn bearish, and we’d start looking for short setups near broken support. We’ll reassess if and when that scenario unfolds.
In terms of upside targets for gold, $3435 has proven to be a tough nut to break and so is the first level of resistance to watch. Above it, there is not much further obvious resistance seen until the April high of $3,500. Beyond that peak, we would be at unchartered territories again, meaning it will be anyone’s guess how much higher will the metal kick on from there.
In conclusion
Our gold forecast for H2 2025 is somewhat neutral. While haven demand has probably peaked, there are other factors that could provide renewed buying momentum for gold, not least more central bank buying amid simmer US fiscal worries.
— Written by Fawad Razaqzada, Market Analyst
Follow Fawad on Twitter @Trader_F_R