Euro Outlook: EUR/USD Fibonacci Support Test
July 9, 2025 17:15Euro, EUR/USD Talking Points:
- After a surprisingly strong start in 2025, EUR/USD came into the second-half showing overbought conditions on both the daily and weekly charts.
- So far in Q3 it’s been a pullback, but the move has been restrained as support has held at a key Fibonacci level so far. There has been a patterning of lower-highs, however, and that can be an opening for bears to prod a deeper pullback move.
- I look into EUR/USD along with the U.S. Dollar in each weekly webinar, and you’re welcome to join the next. Click here to register.

As we came into the year the parity calls for EUR/USD were plentiful, and it seemed there was little hope, at least from the headlines, that the pair would reverse the aggressive downtrend that showed up in Q4. The RSI indicator on the weekly chart pushed into oversold territory at the start of the year and just a couple of weeks into 2025, the pair found support at a massive spot – the 23.6% retracement of the 2021-2022 major move.
The next month and change was a grinding period but notably, EUR/USD held a higher-low in February as the 1.0500 level was continually tested, leading to an ascending triangle formation – and that broke out in a big way in March as recession fears took over in the United States, and suddenly, the trend had flipped in the world’s largest currency pair.
It didn’t take long as a strong thrust in March led to overbought RSI on the weekly in April, and that was the first such instance since 2020. There was a four-week pullback but buyers remained aggressive, coming back in mid-May to push back up and, this time, above the 1.1500 handle.
The move has been grinding over the past month-and-a-half but there’s still no evidence that bulls are ready to relinquish the reins. It is increasingly difficult to chase, however, as weekly RSI has pushed back into overbought territory and as the door opened into Q3, daily RSI had, as well.
EUR/USD Weekly Chart
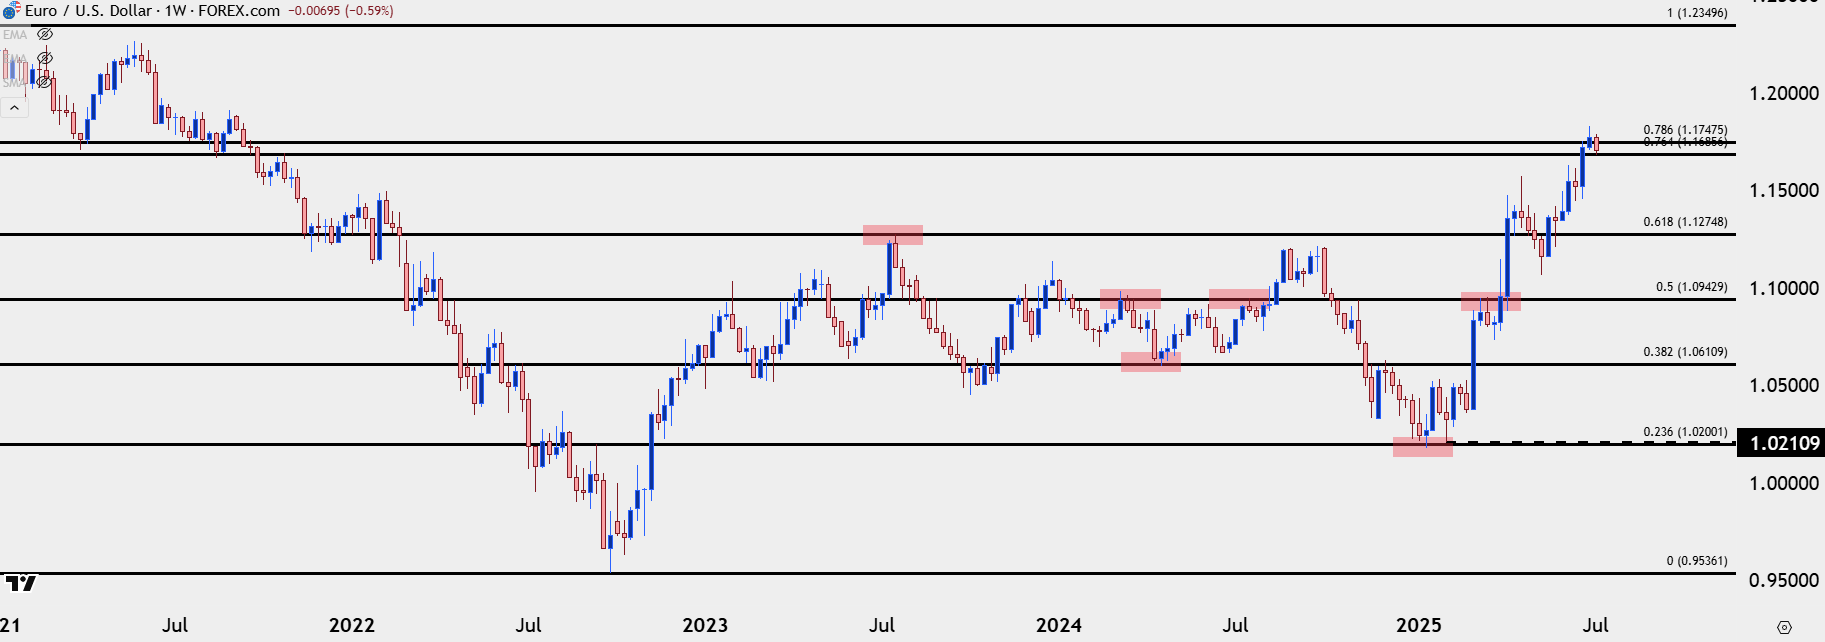
Chart prepared by James Stanley; data derived from Tradingview
EUR/USD Shorter-Term
The Euro is 57.6% of the DXY quote so many of the happenings in the Dollar will show clearly in EUR/USD and vice versa. So, to match that overbought reading in EUR/USD, we’ve also seen oversold readings in DXY on both weekly and daily charts as we came into Q3 trade. I talked about this in the webinar yesterday and RSI alone is not an automatic case for reversal – it merely highlights that the current trend is a bit long-in-the-tooth and if chasing in the trend side direction, the possibility of pullback or excursion must be expected as the one-sided positioning in the pair can be prone to profit taking.
With that said, the current area where EUR/USD has started to show signs of stall is an interesting spot, and it relates back to that same Fibonacci retracement that helped to catch the low back in January. The 2021-2022 major move has shown several inflections at key Fibonacci levels, such as the low in April of last year at the 38.2% retracement, or the multiple tests at the 50% mark of 1.0943. The 61.8% marker caught the high back in 2023 at 1.1275, and that level was back in-play as support-turned-resistance-turned-support again in April and May.
At this point, it’s the 76.4 and 78.6% retracements that are in the equation as we’ve seen each level show inflection over the past two weeks.
EUR/USD Daily Chart
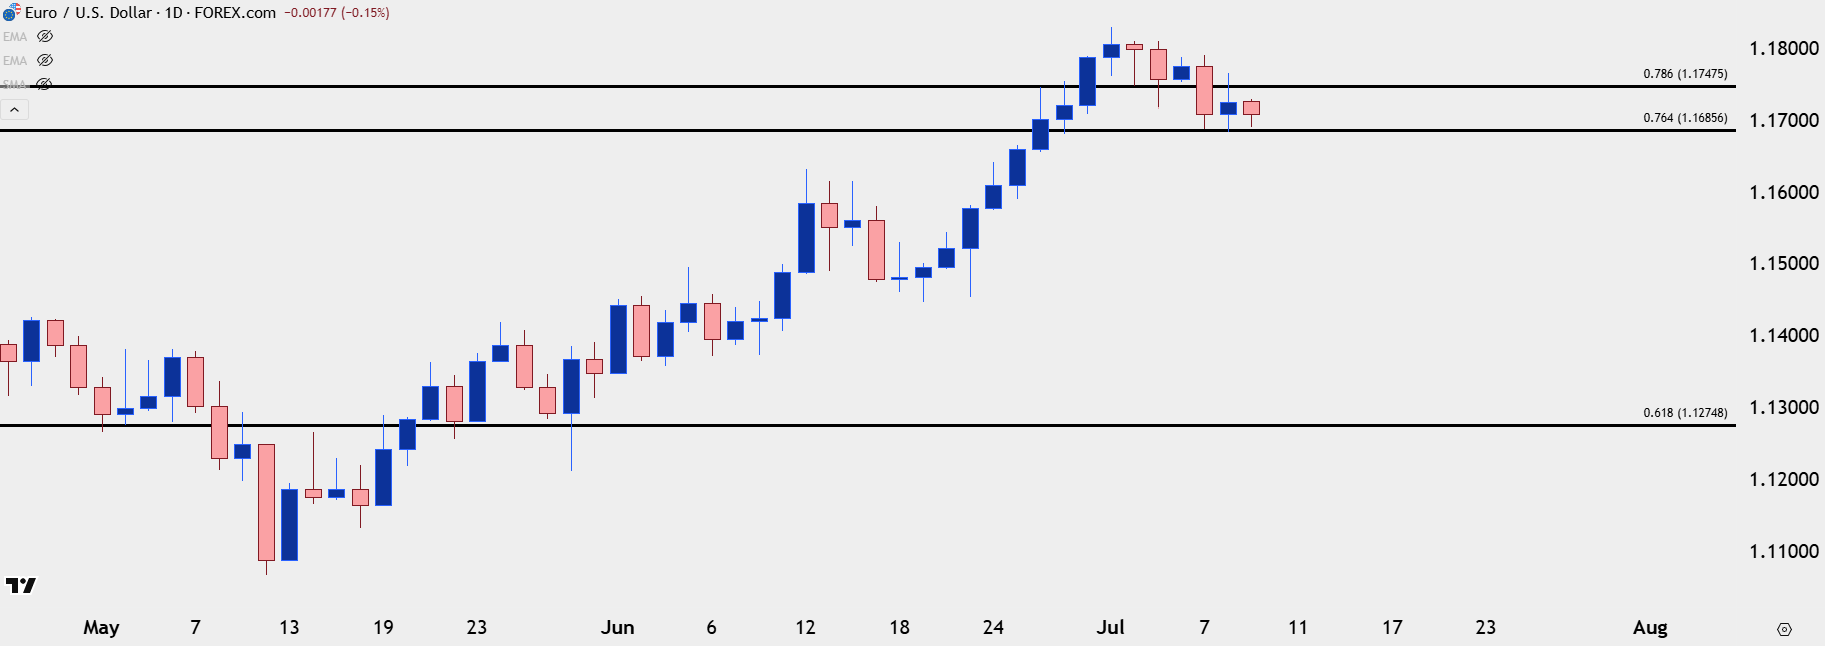
Chart prepared by James Stanley; data derived from Tradingview
EUR/USD Shorter-Term Strategy
I looked at this in-depth during yesterday’s webinar and EUR/USD remains in a very similar state a day later. There’s a short-term descending triangle as taken from horizontal support and lower-highs, and that’s a formation that’s often approached with aim of bearish breakdown potential.
This wouldn’t necessarily mean that the bigger picture bullish trend is ready to reverse as a short-term break could be qualified as a simple pullback in the larger trend, but as to whether that can come to fruition, the way that bulls respond to deeper supports can be telling.
I’ve added a shorter-term Fibonacci retracement on the below chart, and there’s considerable confluence with the longer-term levels looked at in yesterday’s webinar. The 23.6% retracement of the recent move aligns with the 76.4% marker of the 2021-2022 major move, which also marks the support side of the descending triangle. If that breaks, there’s a prior swing of resistance at 1.1632, and that’s followed by the 38.2% retracement of the shorter-term move at 1.1593. Below that, I’m tracking a prior resistance point at 1.1573, but the major decision point, what I’m looking to as illustration of whether sellers can take a greater role to drive a larger retracement, is the 50% marker which aligns with a prior swing of support-turned-resistance at 1.1520/1.1524.
If bears can take out that ‘s3’ zone of support, the bigger picture backdrop will look more fitting for a larger reversal, and at that point, the shorter-term levels of prior support can be re-assigned as lower-high spots of resistance.
EUR/USD Four-Hour Price Chart
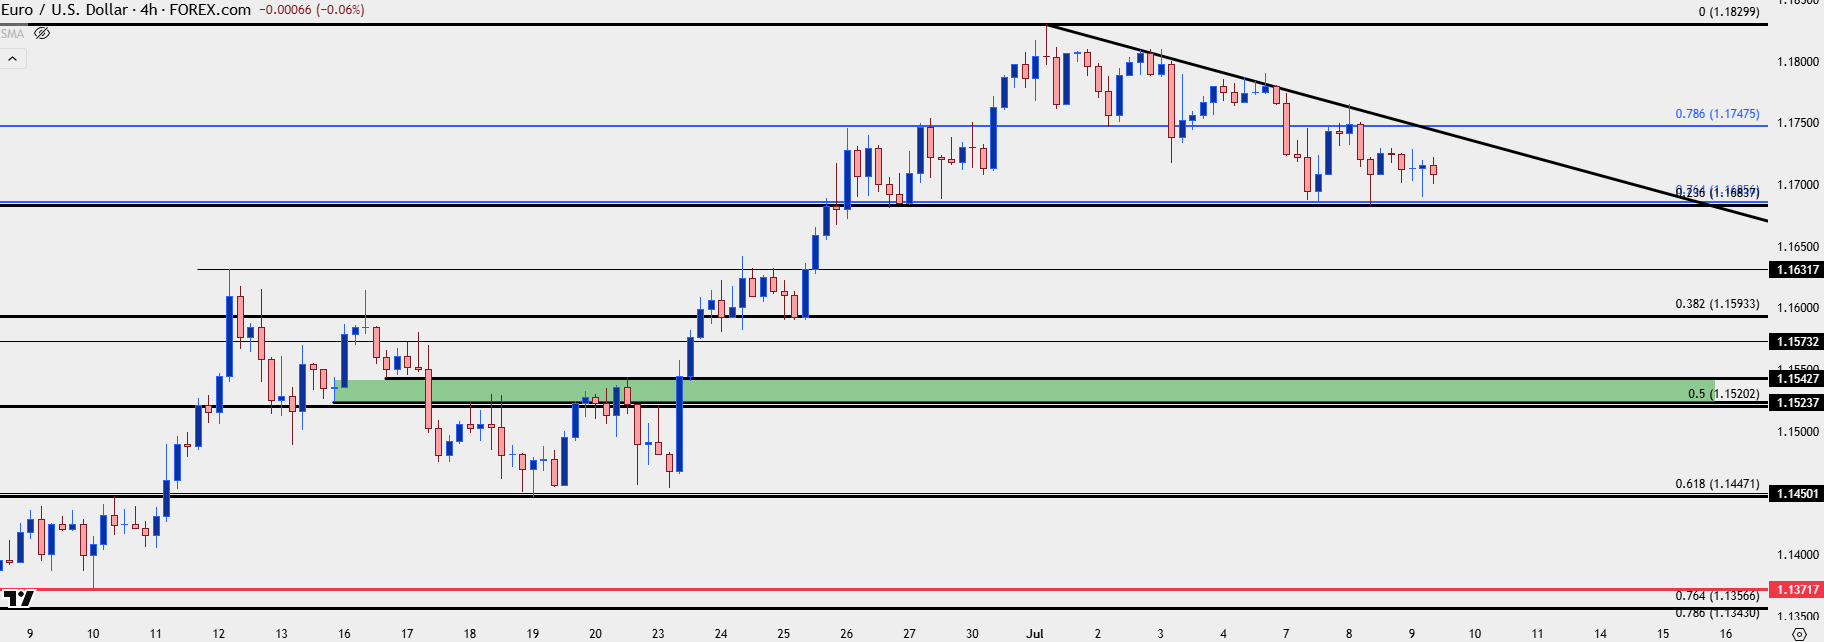 Chart prepared by James Stanley; data derived from Tradingview
— written by James Stanley, Senior Strategist