Euro Forecast: EUR/USD Rips from Dip but Which Trend Will Prevail?
August 3, 2025 09:00Euro, EUR/USD Talking Points:
- It was a wild week in EUR/USD as the pair continued its breakdown from a rising wedge formation, quickly pushing into oversold territory on the four-hour chart on Thursday.
- The 1.1400 handle stood in as support and the Friday NFP report brought a pullback to EUR/USD – but so far resistance has held at prior support and bears have an open door to make a push if they can grind through the 1.1500 handle.
- I’ll be looking at EUR/USD and several USD markets in the Tuesday webinar and you’re welcome to join. Click here to register.

The recent bearish trend in EUR/USD pretty much started around the ECB rate decision in July, although that can be spanned back to the Q3 open, just after EUR/USD set a fresh three-year high. A pullback from that led to a big test around 1.1560-1.1593, and that bounce led into that ECB meeting, with price ultimately holding a lower-high at 1.1788.
After that, however, the sell-off was consistent and prices quickly dropped through the 1.1500 handle after the FOMC meeting last Wednesday, eventually finding support at 1.1400. That’s where sellers were stifled on Thursday and a fast snap back on Friday around Non-farm Payrolls led to a pullback in the move for EUR/USD.
The below weekly chart highlights this dynamic well, where the continued sell-off from the rising wedge ran into an oversold state on the four-hour chart on Thursday, around when that 1.1400 level was coming into play.
EUR/USD Weekly Chart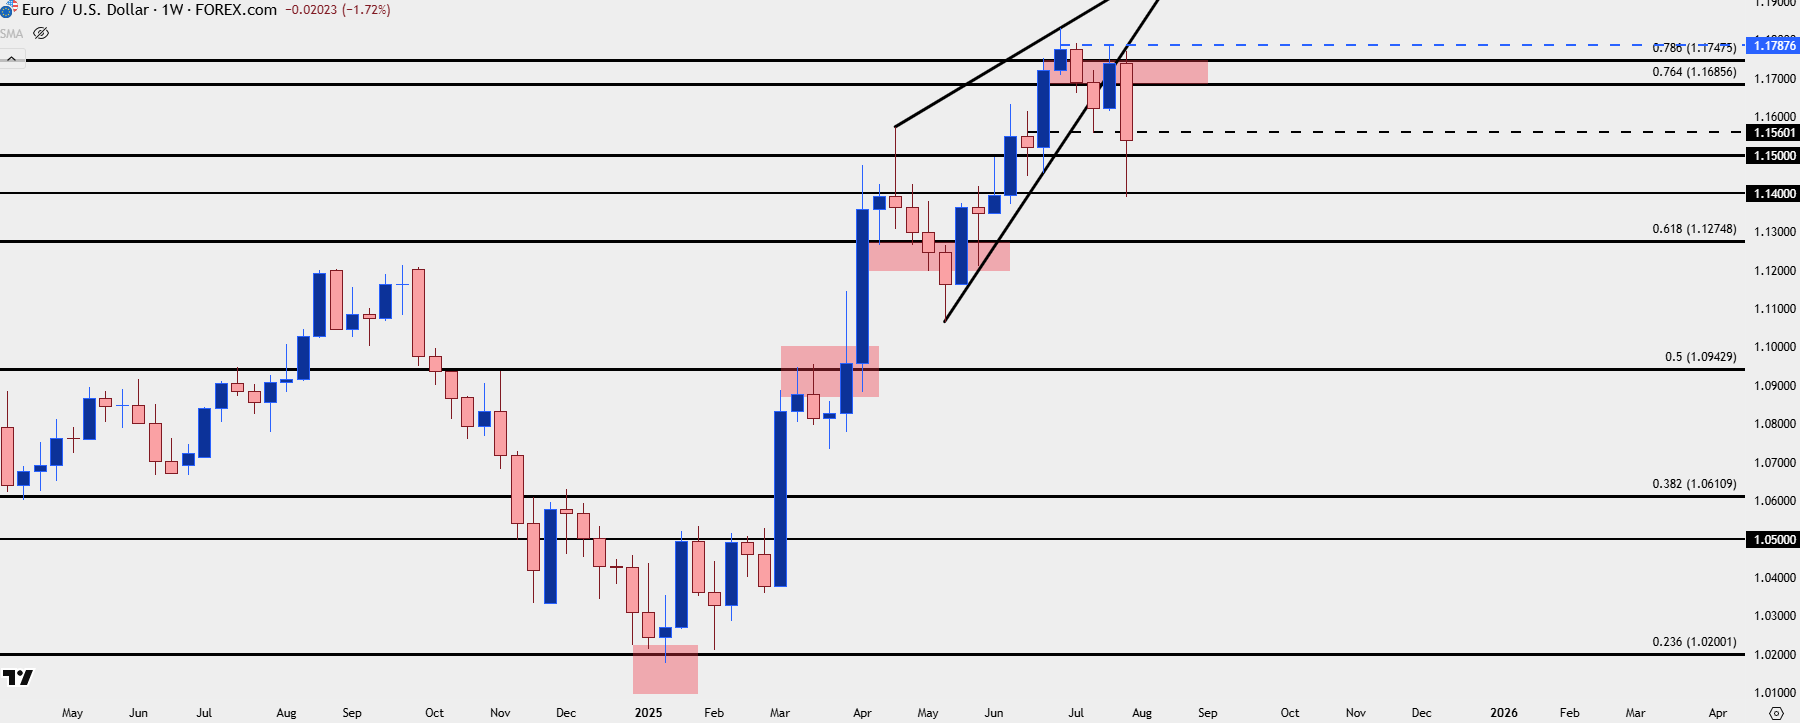
Chart prepared by James Stanley; data derived from Tradingview
Given the rather dramatic drop that pushed through the FOMC rate decision, the question now is whether sellers are still interested in the trend following the bounce around the NFP report. So far, we have a lower-low and this opens the door for lower-high potential. There’s already a resistance zone in-play from prior support, around the 1.1573-1.1593 zone; and above that there’s another couple of spots of resistance potential at 1.1632 and 1.1663.
EUR/USD Daily Price Chart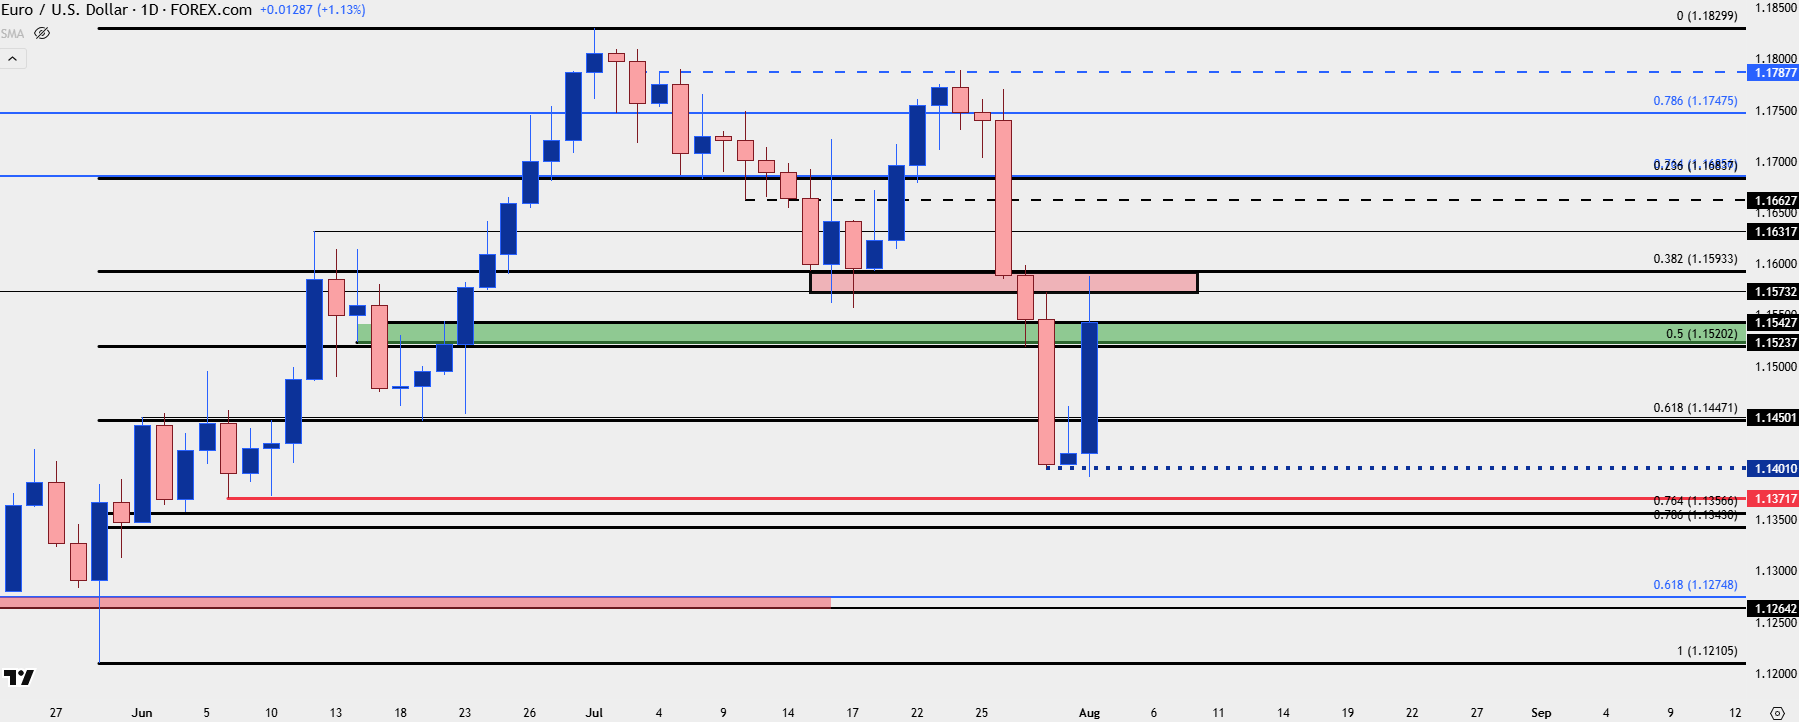
Chart prepared by James Stanley; data derived from Tradingview
EUR/USD Near-Term
Given the size of the Friday rally it’s at least worth entertaining the bullish scenario in EUR/USD. And from the four-hour chart we can see some additional context, while also highlighting just how oversold the move had become on Thursday with four-hour RSI going all the way down for a reading of 20.10.
At this point, from the four-hour a higher-high can be argued and that then leads to the question as to whether a higher-low can show. If so, the 1.1500 level becomes a vital spot on the chart, and as of this writing we’re seeing some support hold in the 1.1524-1.1543 zone.
If bulls can hold a higher-low, this opens the door for those deeper resistance levels mentioned above, at 1.1632 and 1.1663. Above that, we also have a critical Fibonacci level at 1.1686 but if bulls can drive all the way up to that, it will look like failure from bears after the Friday bounce extended through multiple points of resistance.
EUR/USD Four-Hour Chart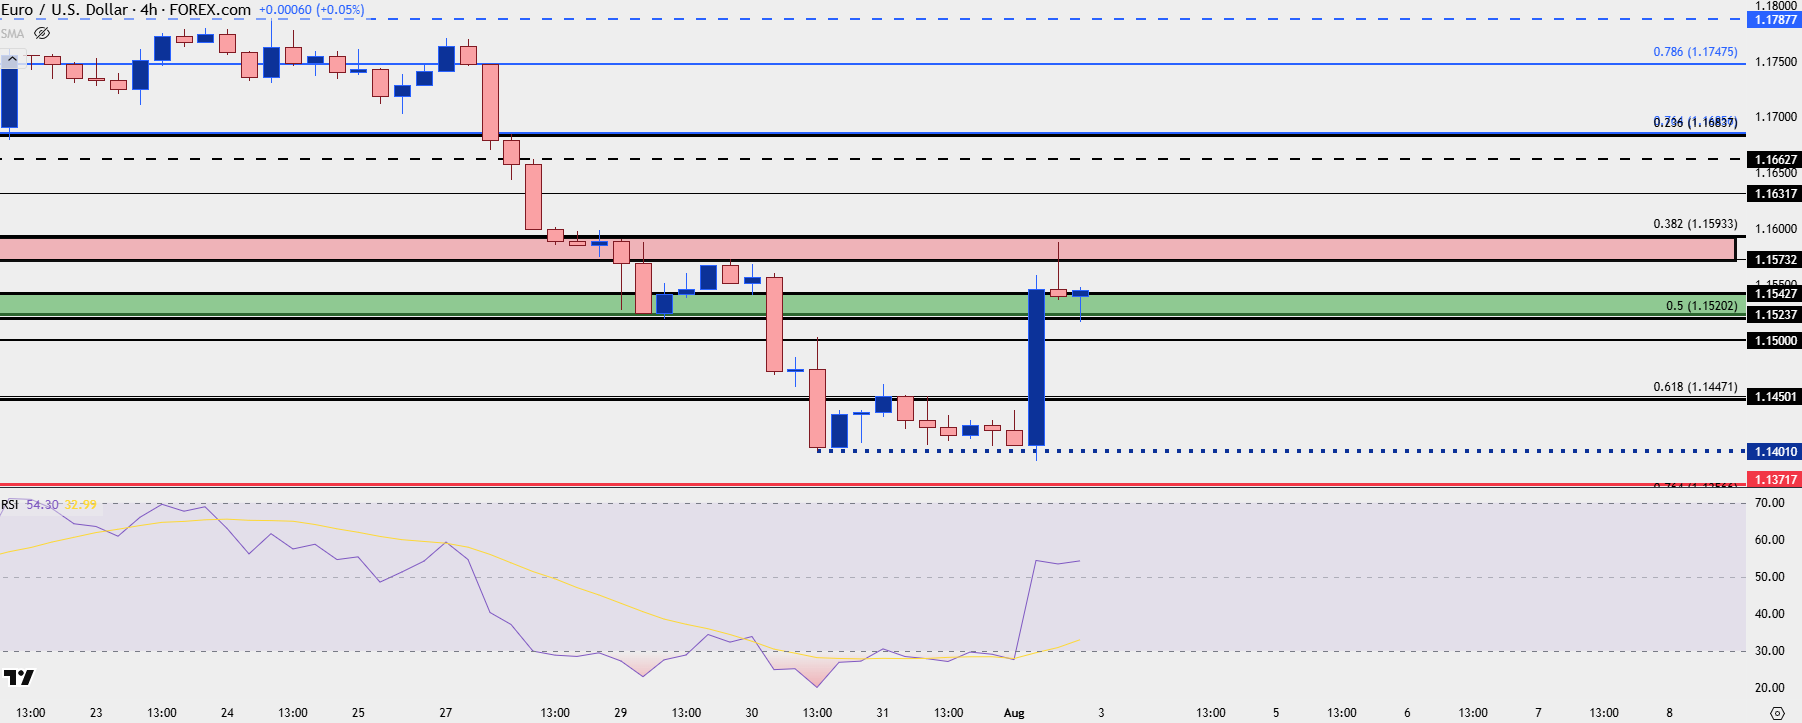
Chart prepared by James Stanley; data derived from Tradingview
— written by James Stanley, Senior Strategist