EUR/USD Technical Outlook: Rally Runs to Next Resistance
August 6, 2025 18:43EUR/USD, Euro Talking Points:
- It’s been a busy week for EUR/USD as the pair pushed down for a test of fresh lows at the 1.1400 handle last week.
- Since then, a rally has emerged after the four-hour chart saw oversold conditions appear, and I looked at an updated setup in yesterday’s webinar. Price has since pushed up to next resistance at the 1.1632 level, opening the door for tests of 1.1663 and 1.1686.
- The bigger question is whether sellers use these rallies to position into shorts, looked at in greater detail below.

So far in Q3 it’s been a pullback type of outing for EUR/USD. The pair set a fresh three-year high on the first day of the quarter and since then, it’s been building in lower-lows and lower-highs.
Last week saw extension of that on the back of the FOMC rate decision and Core PCE, and while Fed rate hikes aren’t exactly being expected, a lower approach with rate cuts helped to remove USD-weakness that had built after a busy first-half of the year.
But on Friday, USD bears got a fresh shot of motivation in the form of a large revision to the headline NFP print of the prior two months. And since then, USD weakness has been clawing back, and this can be evidenced in EUR/USD walking higher on the chart, initially finding resistance at the 1.1560-1.1593 zone, and then finding a higher-low in support from 1.1524-1.1543, and now an extension of that move up through next resistance at 1.1632, with the next level of resistance at 1.1663 just a little higher on the chart.
These levels have all been part of my backdrop on EUR/USD in recent webinars. I had looked at the sell-off last week ahead of the Fed, and then the retracement in yesterday’s webinar as the shorter-term higher-highs and lows had begun to build.
EUR/USD Four-Hour Chart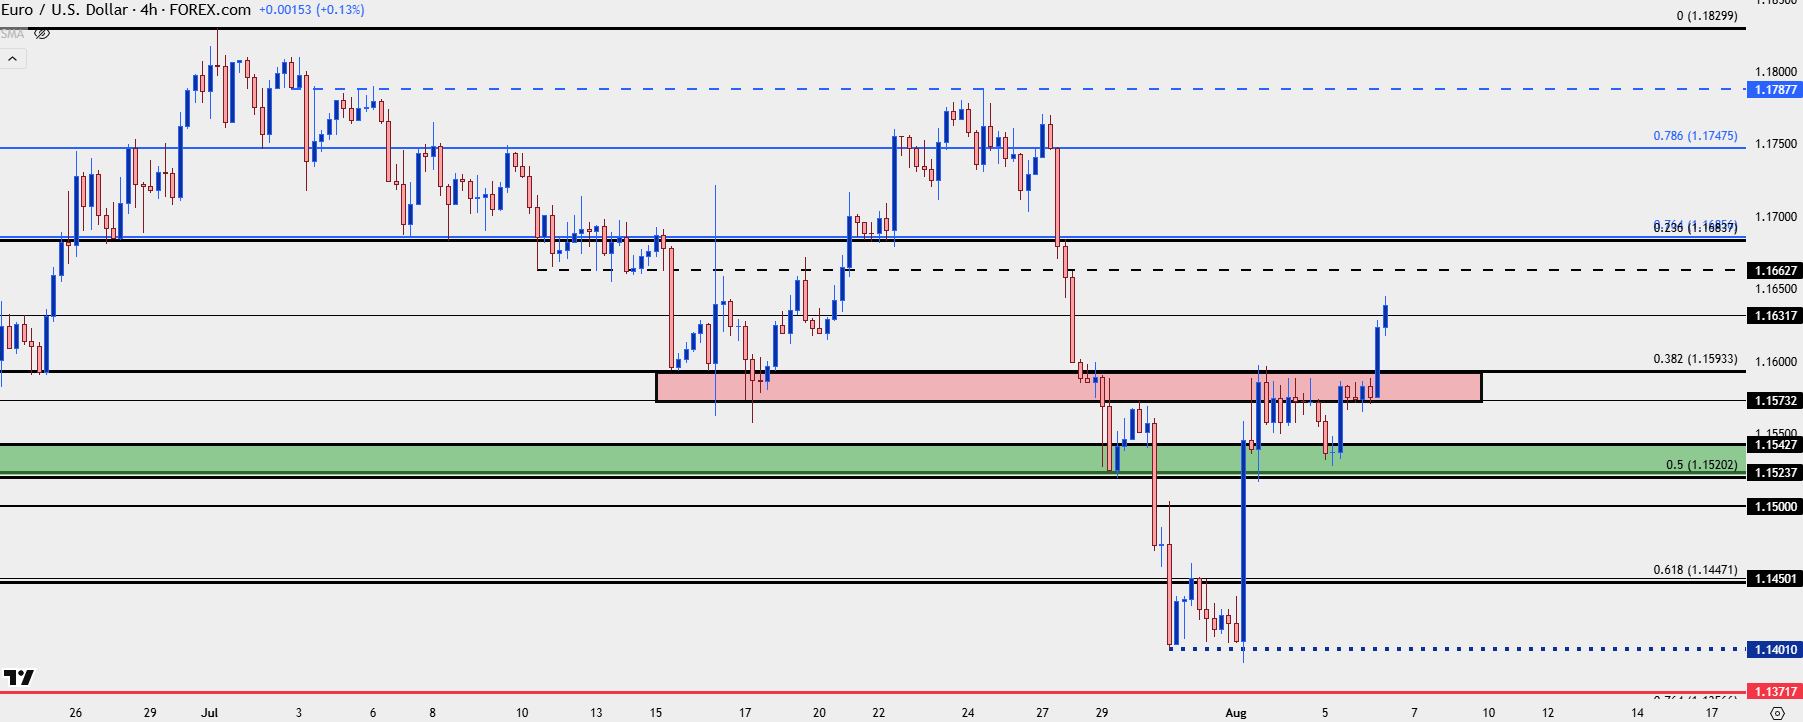
Chart prepared by James Stanley; data derived from Tradingview
EUR/USD: Trends Are Made During the Counter-Trend Reactions
After that fresh three-year high on day one of Q3, it’s been lower-lows and highs in EUR/USD. The first lower-high from that showed around the ECB rate decision two weeks ago, right at the 1.1788 level, after which a strong sell-off developed through the FOMC rate decision a week later.
The pair had quickly pushed into oversold territory on the four-hour chart, and the question now is whether sellers come in to defend another lower-high in EUR/USD. If so, there’s a few notable spots to track for such, like the 1.1748 level which is the 78.6% retracement of the 2021-2022 major move.
Below that, we have the 76.4% Fibonacci retracement of that same move plotted at 1.1686, and then there’s a prior swing of support-turned-resistance at 1.1663.
EUR/USD Daily Chart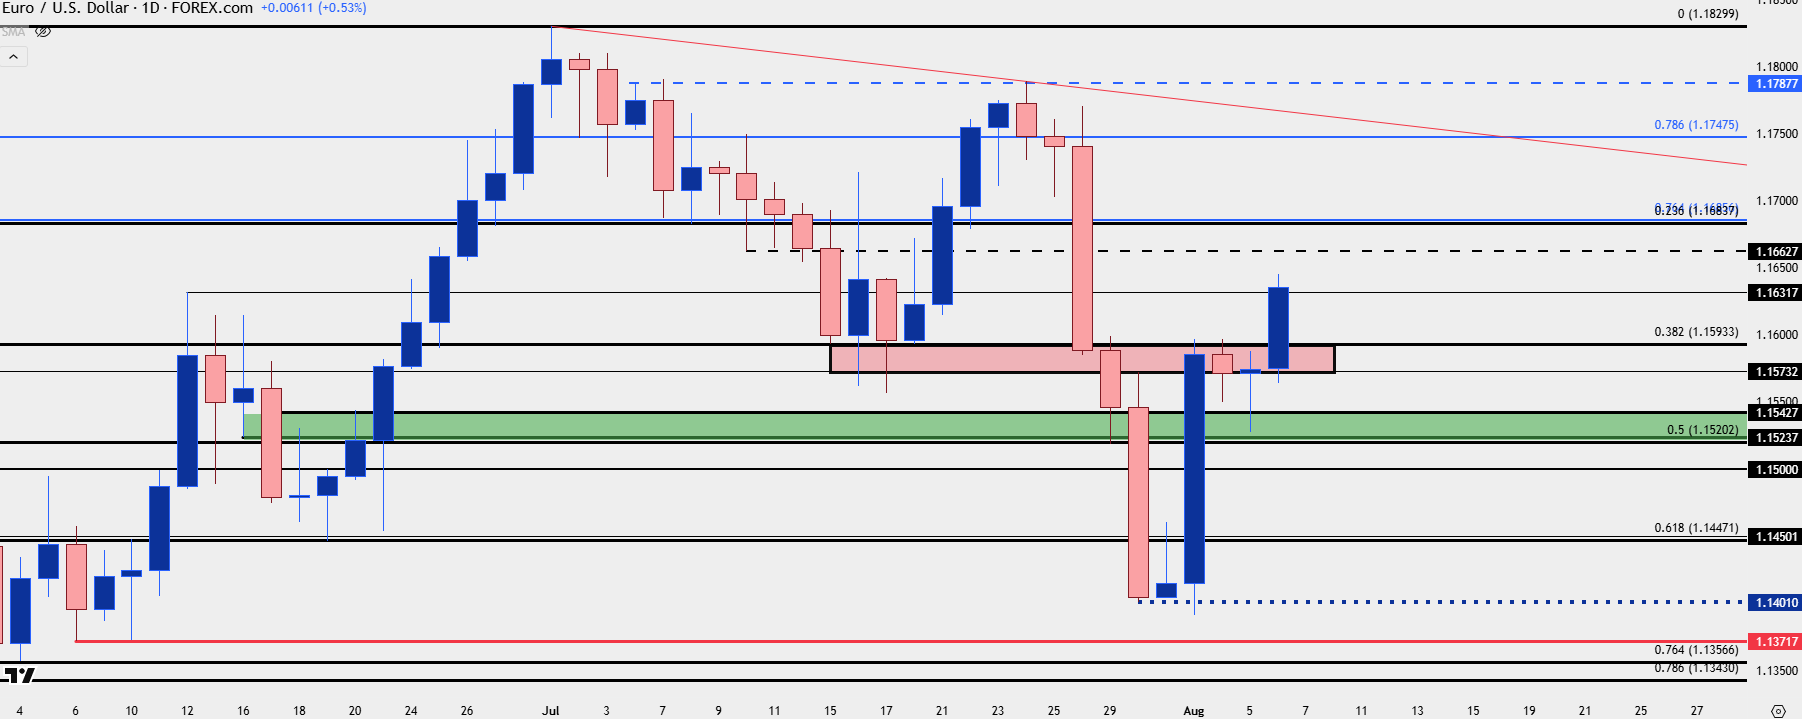
Chart prepared by James Stanley; data derived from Tradingview
— written by James Stanley, Senior Strategist