EUR/USD Resistance as USD Tests Confluent Support
August 13, 2025 21:04EUR/USD Talking Points:
- So far in Q3 EUR/USD has built a structure of lower-lows and lower-highs, but that may soon come in to be tested as both EUR/USD and the USD have been pulling back so far in August.
- As I looked at in the webinar yesterday last year’s FOMC rate cuts saw markets selling the USD into the actual start of cuts, after which a bullish rally developed in DXY in Q4 as long-term Treasury yields rose.
USD Tests Confluent Support
Rates markets have hurriedly priced in rate cuts so far this month and at this point there’s a 99% probability of a rate cut in September. There’s also strong odds of at least one more rate cut by the end of the year and perhaps two more cuts.
While that’s had some impact on the USD with a bearish series presenting so far in August, the bigger picture is less clear as the higher-low from July has, so far, remained in-play, and we’re even seeing a degree of support from the trendline produced by that higher-low. That’s drawn in black below, and there’s also a longer-term trendline shown in blue which presents an area of confluence on the chart.
US Dollar Daily Price Chart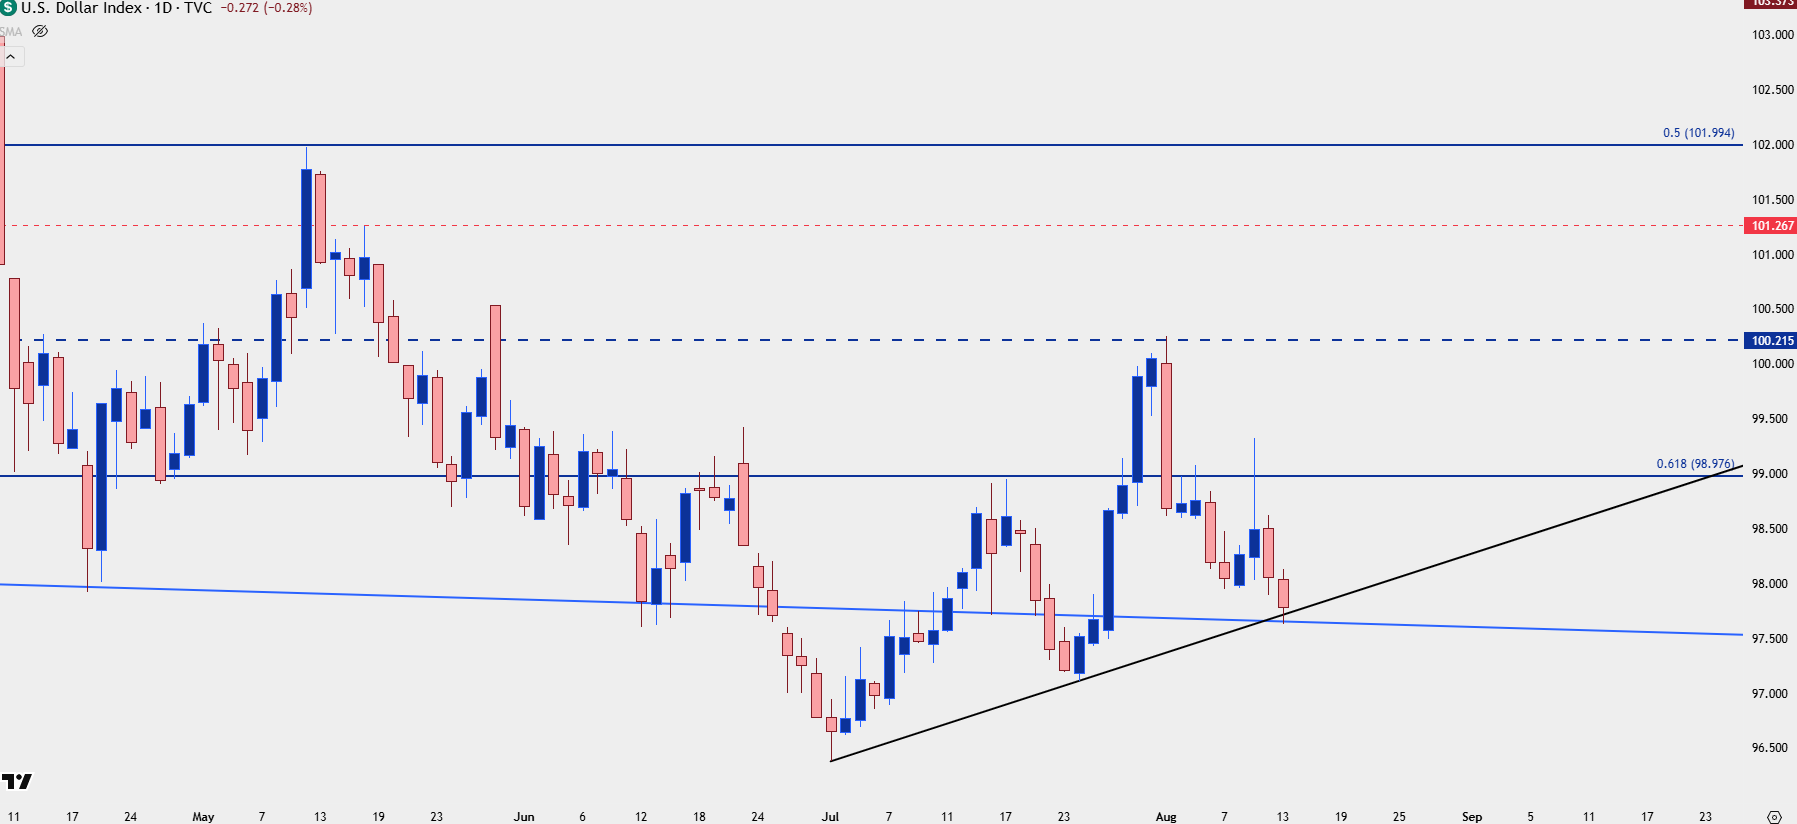
Chart prepared by James Stanley; data derived from Tradingview
Currency Dynamics
Currencies are unique in the fact that they’re the foundation of the global economy. And the only way to value a currency – is with another currency. So for something like the US Dollar, the DXY basket is comprised of currencies like the Euro at a 57.6% clip, or the Japanese Yen at a 13.6% allocation. Meaning, if we’re seeing a consistent move of USD-weakness, then other currencies are going to need to take on strength.
We can see that dynamic in-play last year. As the market was walking towards FOMC rate cuts in September, EUR/USD was rallying up to the 1.1200 level, and USD was going oversold. But it was just as the Fed started cutting rates that DXY established a low and sellers couldn’t break through that. Alongside, EUR/USD held resistance at 1.1200, and even with the Fed cutting in Q4 of last year, the US Dollar jumped-higher and EUR/USD tanked – helped along by a large move in US Treasury Yields.
So, at this point the very real question remains as to whether an FOMC rate cut will bring on any additional USD weakness, especially given that the Dollar is at higher-lows even with probabilities for cuts running so high.
This then brings on the other side of the matter, with the Euro. As a 57.6% component of the DXY basket, if we are going to see USD-weakness, the Euro will probably need to take on strength. And at this point, like the USD chart above, EUR/USD still has bearish structure on the daily as taken from the lower-highs and lows that built in July.
That structure may soon be tested as the August pattern, so far, has run counter to that, with bulls scaling-higher following a support hold at the 1.1593 level earlier this week, extending the gyration from last week.
EUR/USD Four-Hour Chart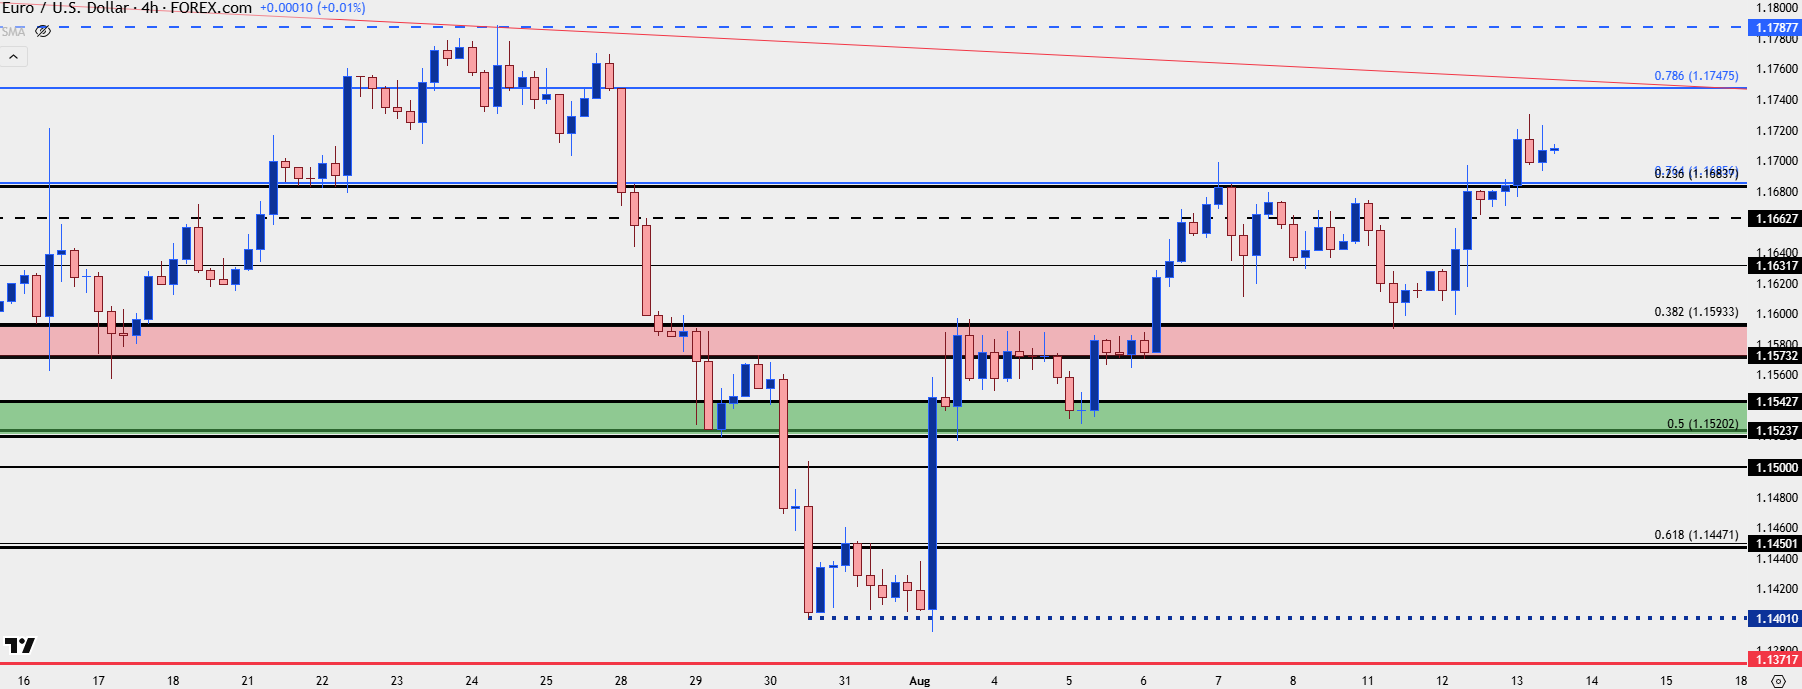
Chart prepared by James Stanley; data derived from Tradingview

EUR/USD Where the Rubber Meets the Road
While the 1.1686 level held a couple doses of resistance so far, it hasn’t been enough for bears to re-take control. And this exposes another level of resistance, the same I had looked at back in mid-July at 1.1788. That’s currently invalidation for bears in EUR/USD, and ideally, if sellers are going to speak up, the 1.1748 Fibonacci level would remain defended. That’s currently confluent with a bearish trendline taken from the lower-highs in July and that projects to later this week or early next week.
If we do see sellers come in to hold highs in EUR/USD at that Fibonacci level, the door remains open for bears to push.
EUR/USD Daily Chart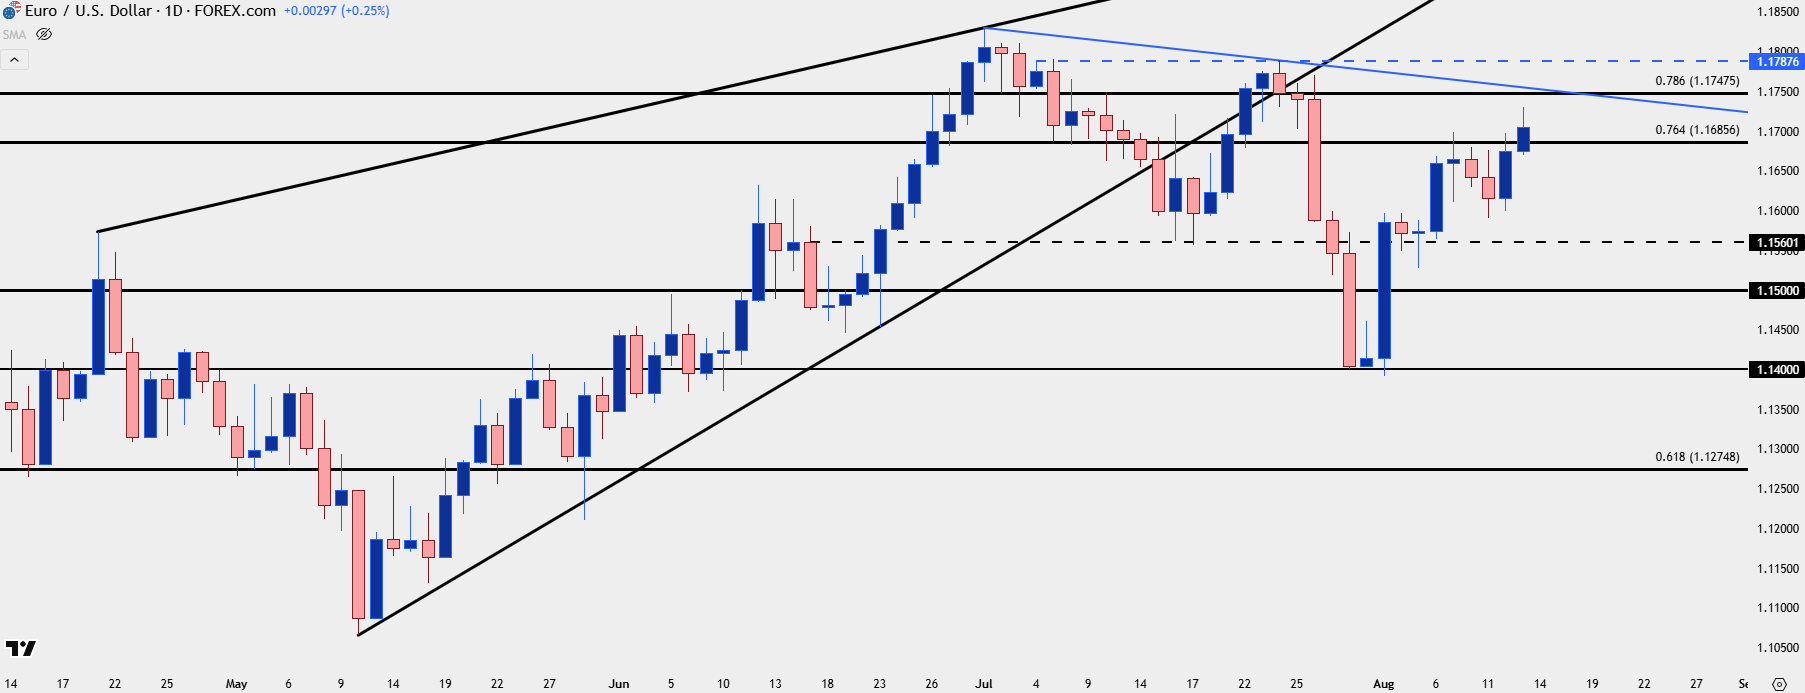
Chart prepared by James Stanley; data derived from Tradingview
— written by James Stanley, Senior Strategist