EUR/GBP Outlook: Euro Favoured as Dollar Declines, British Pound Lags
September 16, 2025 07:14The euro outperformed on Tuesday following stronger-than-expected ZEW sentiment data for Germany and the broader eurozone. The release reduced expectations of further ECB easing after last week’s meeting, where policymakers held rates steady and described risks as “balanced” with the outlook in “a good place.” At the same time, the US dollar softened as traders positioned for a dovish Fed cut later today. Together, these dynamics left EUR/USD looking more constructive than GBP/USD, helping EUR/GBP extend gains as the pound lagged behind.
View related analysis:
- British Pound Price Action Setups: GBP/USD, GBP/JPY, GBP/CAD, GBP/AUD
- EUR/USD and GBP/USD Outlook: Bullish Patterns Form as Dollar Wavers
- GBP/USD, EUR/GBP: COT Data Appears Favourable to British Pound Bulls
- USD/JPY, EUR/JPY, AUD/JPY Outlook: Dollar, Yen Weakness Into FOMC, BOJ
EUR/GBP Outlook: Euro Favoured as Dollar Weakens, Pound Lags
The euro was a strong performer on Tuesday, buoyed by an upbeat ZEW report for Germany and the broader eurozone. With the ECB leaving rates unchanged last week, describing risks as “balanced” and the outlook as “in a good place,” expectations of further cuts have diminished – reinforcing the view that the easing cycle is likely over. At the same time, traders are positioning for a dovish Fed cut later today, leaving the US dollar weaker and allowing EUR/GBP to outperform GBP/USD.
EUR/USD vs GBP/USD: Diverging Inverted Head and Shoulders Patterns
I previously highlighted the potential inverted head and shoulders patterns forming on the daily charts of EUR/USD and GBP/USD. The structure on the euro’s chart looks far more convincing, whereas I remain sceptical of the validity of the pattern on the British pound. This makes EUR/USD the more attractive option for bulls compared to GBP/USD in my view, and also underpins my near-term bullish bias on EUR/GBP.
It is worth noting that the daily RSI (2) is overbought for both EUR/USD and GBP/USD, warning of near-term overextension to the upside. However, their respective RSI (14s) confirm the move higher without yet being overbought. In both cases, dips may appeal to bulls – though EUR/USD appears to stand the better chance of reaching its inverted head and shoulders target, which sits around 1.21.
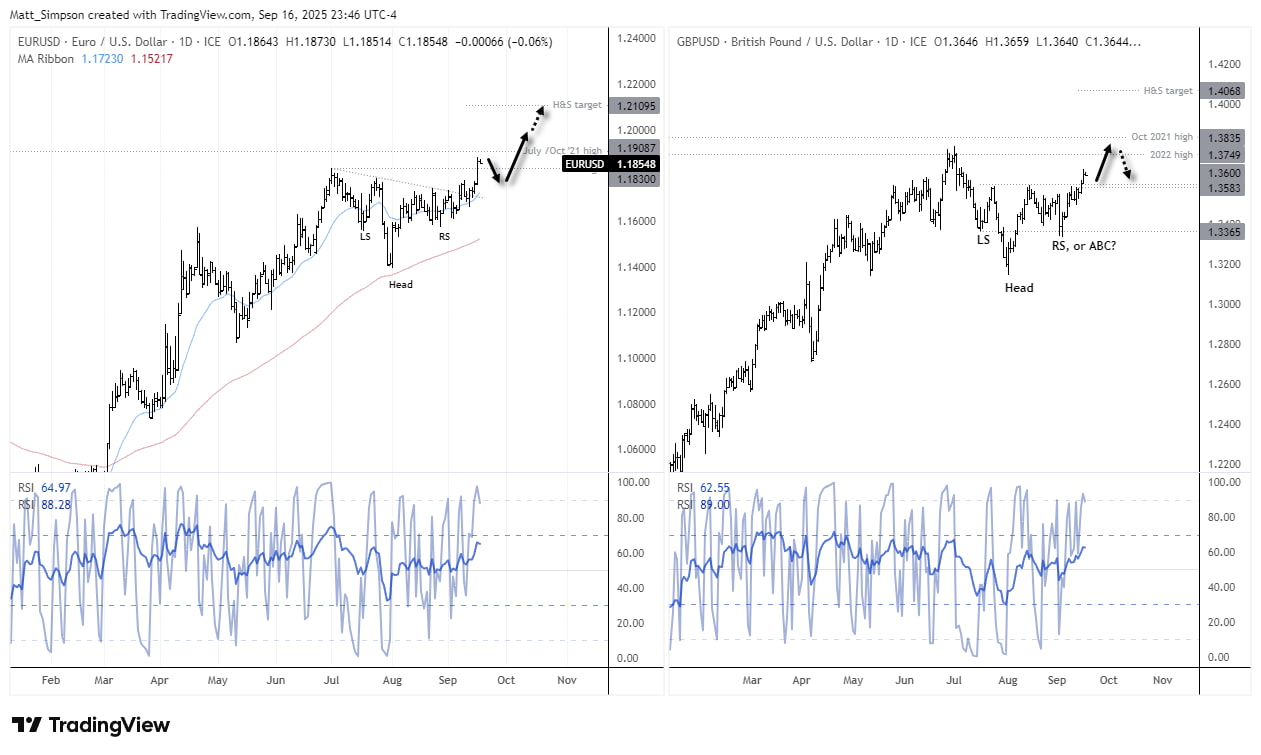
Chart analysis by Matt Simpson – data source: TradingView EUR/USD, GBP/USD

EUR/GBP Technical Analysis: Euro vs British Pound
Much of this year’s volatility for EUR/GBP was concentrated between March and May, during the peak of Trump-tariff concerns. Its current high-to-low range of 6.5% has already exceeded those of the previous two years, with more than a quarter of the year still to play out.
The weekly chart shows momentum turning higher. A series of lower wicks formed around the rising 10-week EMA, and at current levels EUR/GBP is on track to post a bullish outside week.
The question now is whether this proves to be a smaller bounce ahead of a sharper move lower, or the prelude to a breakout above the 2025 high. Futures positioning suggests the latter.
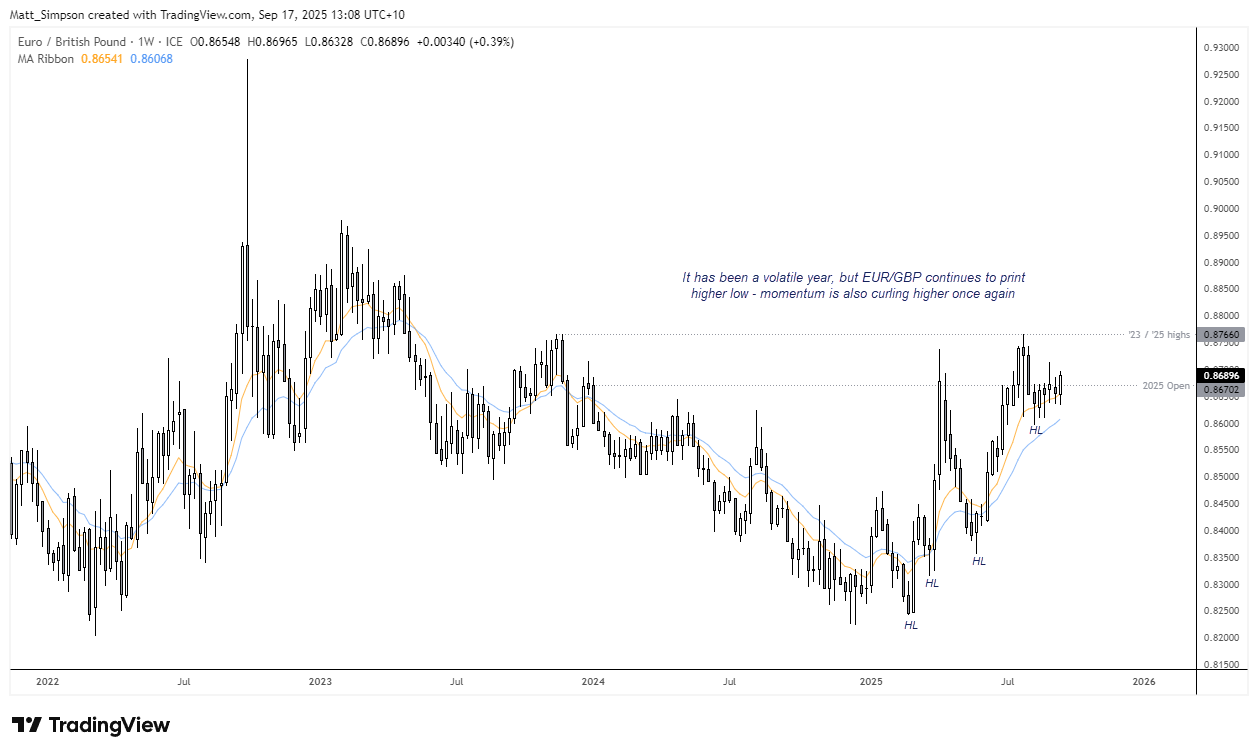
Chart analysis by Matt Simpson – data source: TradingView EUR/GBP
EUR/GBP Trader Positioning – COT Report Analysis
Although the weekly Commitment of Traders (COT) report has dedicated data for EUR/GBP futures, liquidity in this market is relatively low. To better gauge sentiment, I have built a higher-liquidity proxy by subtracting GBP/USD futures positioning from EUR/USD futures data. This method provides a reasonable measure of relative bullish and bearish exposure between the euro and the pound against the US dollar.
The proxy COT charts for EUR/GBP show net-long exposure continuing to rise, driven by an increase in gross-longs and a reduction in gross-shorts. This trend is consistent across both large speculators and asset managers.
It could be argued that asset managers net-long exposure is approaching a sentiment extreme, but that could still allow for a rise of bullish bets over the near term. And as EUR/GBP remains well below its 2023 peak, perhaps EUR/GBP is set to breakout above the 2025 high in the coming weeks.
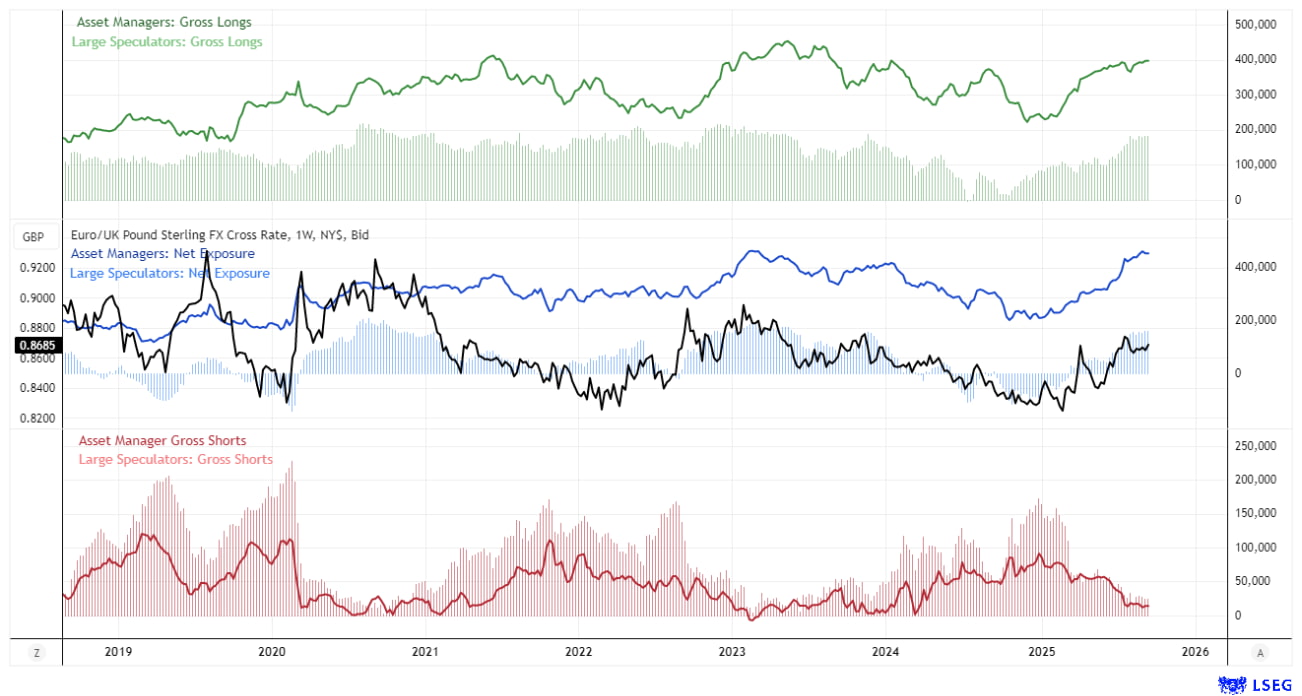
Chart analysis by Matt Simpson – data source: IMM, CME, LSEG

EUR/GBP Technical Analysis: Daily Chart
The daily chart shows EUR/GBP trending higher, with momentum turning firmly bullish after holding above the 50-day EMA. Price action has coiled into a series of converging highs and lows, resembling a symmetrical triangle pattern (albeit not a textbook one). Even so, momentum has realigned with the dominant uptrend, and with futures positioning showing traders increasingly bullish on EUR/USD relative to GBP/USD in the latest COT report, dips within yesterday’s range may appeal to euro bulls targeting the 2023 and YTD highs around 0.8766.
Traders should also note the 2025 open at 0.8670, which could act as support in the near term. A bullish bias may be retained while EUR/GBP holds above the recent 0.8632 swing low.
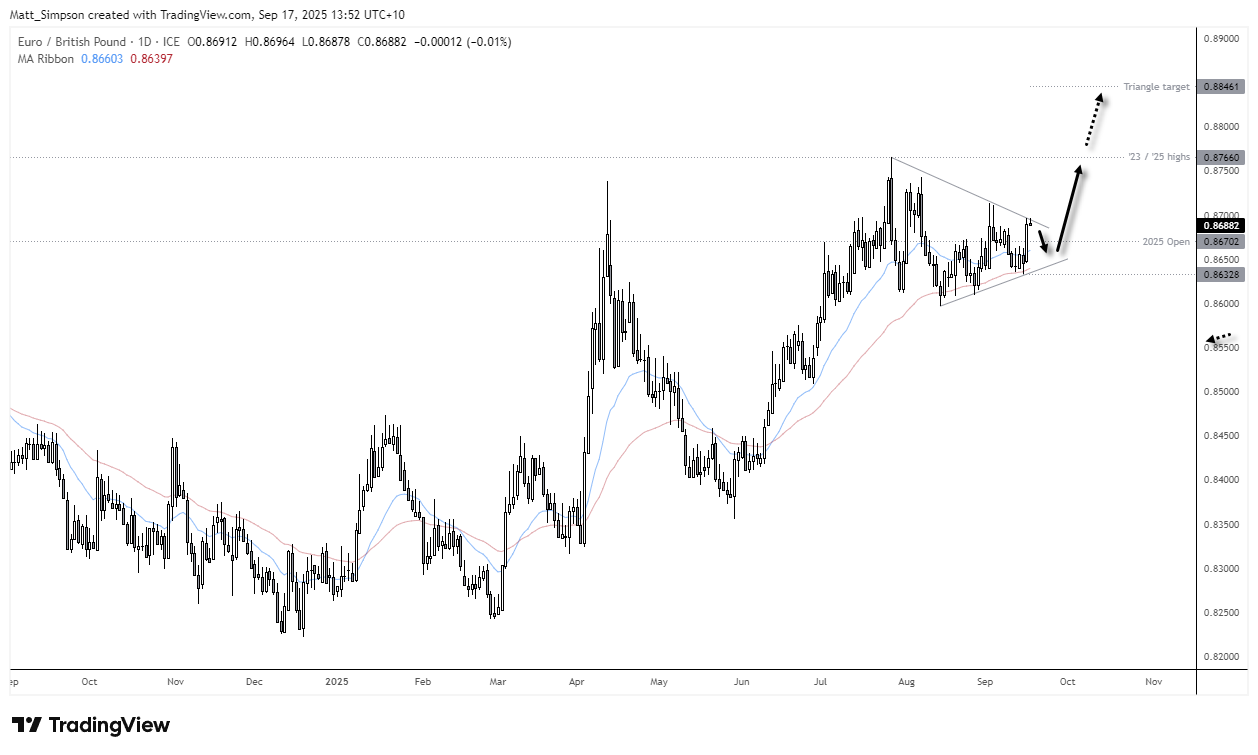
Chart analysis by Matt Simpson – data source: TradingView EUR/GBP
View the full economic calendar
— Written by Matt Simpson
Follow Matt on Twitter @cLeverEdge