Dollar Bounce Pressures EUR/USD Back Below 1.18, Gold Below 3700
September 19, 2025 12:01Key Events
• EUR/USD’s latest pullback is set to be tested with next week’s flash PMIs and the dollar’s rebound potential
• Gold prices traced wild swings, leaving traders cautious as the haven asset gets pressured below the $3,700 mark
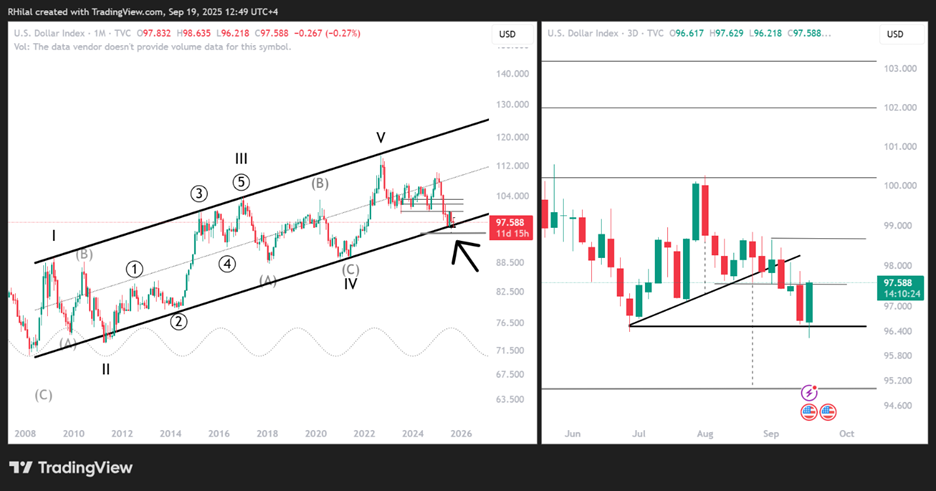
• U.S. Dollar Index weakness and dovish impact may already be priced in, as the greenback holds above 17-year support
DXY Outlook: Monthly-Daily Time Frame – Log Scale

Source: Tradingview
All eyes were on the head and shoulders pattern on the DXY, and the inverted head and shoulders patterns on the EUR/USD and GBP/USD charts, which extended forecasts toward new 2025 highs on the euro and pound, and new lows on the DXY.
However, the dollar’s weakness reflected priced-in dovish expectations for the 25 bps cut and an overall 75 bps cut by year-end, reaffirming the strength of the 17-year trendline and 96.00 support on the U.S. Dollar Index chart, which traced a clear rebound—pulling major markets down from their 2025 highs.
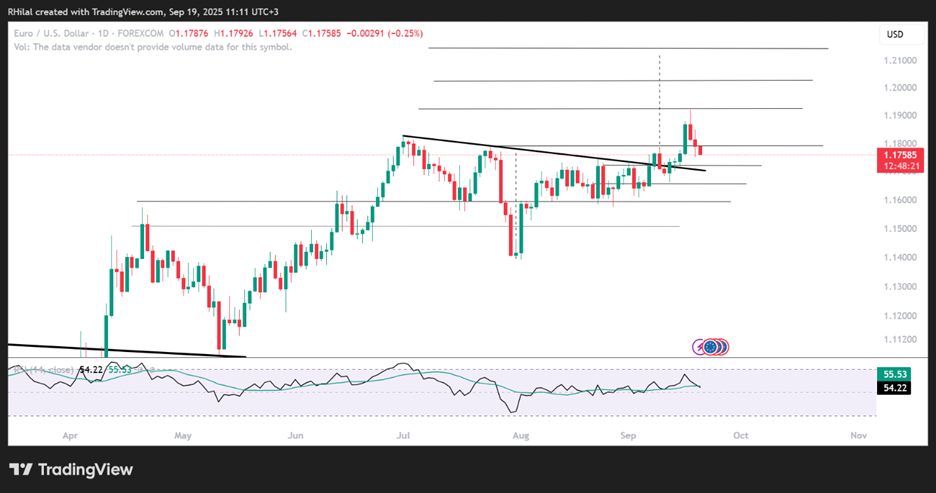
Zooming In to the Daily Chart on EUR/USD
Source: Tradingview
We can see that the inverted head and shoulders breakout has only reached halfway so far, pulling back toward the formation’s neckline, now targeting levels at 1.1750 and 1.1720.
A clean hold below 1.1720 may invalidate the continuation of the pattern, pulling the pair back toward 1.1650 and 1.1590, respectively.
From the upside, should the pair hold above 1.1720 and climb back above 1.1830 and 1.1920, the trend may continue toward levels last seen in 2021, at 1.2020 and 1.2140, respectively.
Should the bullish scenario play out, the DXY would be expected to align with lows last seen in 2021, and the GBP/USD would be expected to rally above 1.40, also last seen in 2021.
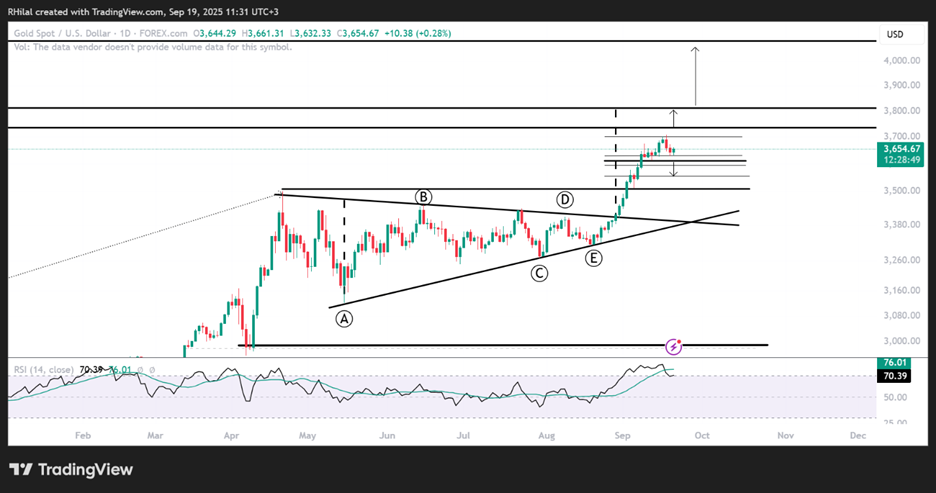
Gold Outlook: Daily Time Frame – Log Scale

Source: Tradingview
Gold prices traced wild swings following the Fed rate cut and FOMC meeting on Wednesday, pulling back below the $3,700 resistance as the U.S. Dollar Index (DXY) rebounded above 97.00.
The dollar’s rebound may reflect priced-in market sentiment, supported by the greenback’s hold above a critical 17-year trendline (as shown on the monthly time frame), which could limit upside potential for risk assets.
Looking at the gold chart, bullish momentum has been building since the breakout from the five-month consolidation, though price has pulled back from the $3,700 resistance.
A clean close above $3,700 is needed to confirm the next leg higher toward the full triangle breakout targets near $3,730 and $3,820, after which a move toward $4,000 may be confirmed.
On the downside, support levels between $3,620, $3,550, and $3,500 are seen as potential buy-the-dip zones. These are relatively wide ranges, and a clean close below each may confirm a further drop toward the next.
Written by Razan Hilal, CMT
Follow on X: @Rh_waves