EUR/USD Broke Down Last Year When the Fed Cut – Could a Repeat Scenario Happen?
August 11, 2025 19:31Euro, EUR/USD Talking Points:
- EUR/USD has held resistance at the 1.1686 Fibonacci level thus far and price has already pulled back for a test of the support zone from 1.1573-1.1593.
- The big driver for FX markets this week is the US CPI report set for release on Tuesday morning, with Core CPI expected to push back up to 3.0% YoY.
- With inflation moving higher the expectation for rate cuts comes under more question so that is a vital data point for US markets that have built in a wide expectation for two 25 bp cuts by the end of the year, and for FX major pairs, EUR/USD is front-and-center.

Rate cuts have been the major question all year for US markets following the Fed’s hurried 100 bps of cuts to end last year. While inflation wasn’t yet down to target on YoY metrics, the Fed still felt the need to cut and the ramification of that probably wasn’t what they expected – as it spurred a round of USD-strength to go along with rising long-term yields.
Normally the expectation would be for yields across the Treasury curve to fall with the Fed cutting rates, but not only did that not happen, the opposite took place. The reason why was inflation expectations, as the rate cuts pushed by the Fed were thought to be a source of inflation longer-term and that helped to boost longer-term US yields. Ten year treasury yields hit a low of 3.6% the week that the Fed started cutting rates last September – and by early January had jumped all the way up to 4.8%. The 30-year, which arguably can be seen as more important as a barometer of US economic health given the tie to 30-year mortgage rates and, in-turn, the housing market, saw a low of 3.9% in September of last year. That was all the way up to 5% in early-January, and has since pushed even higher, with a May high of 5.15% and another test of the 5-handle in mid-July.
30-Year Treasury Rates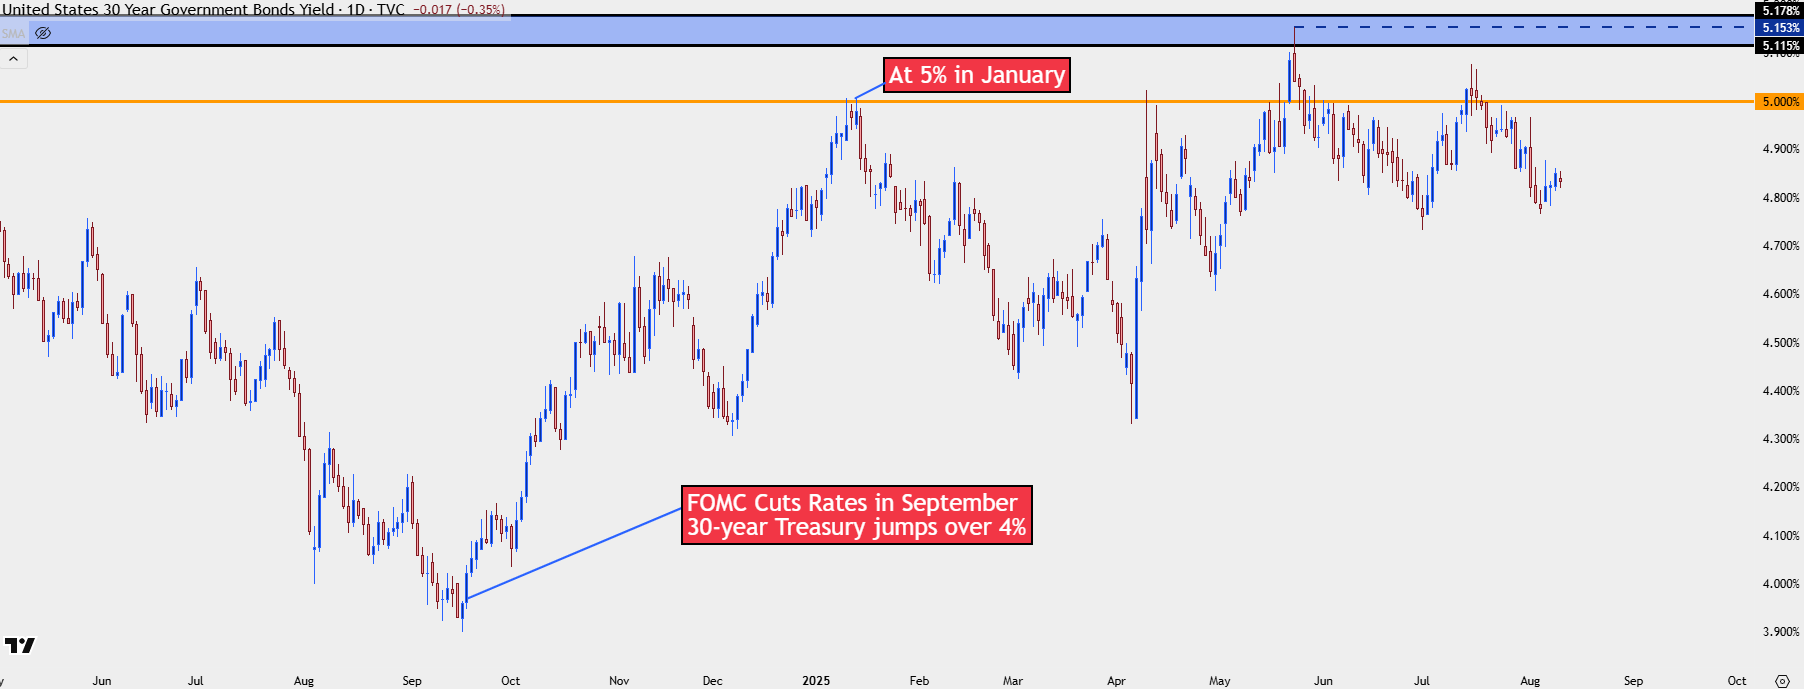
Chart prepared by James Stanley; data derived from Tradingview
With inflation already moving higher there’s the big question as to whether the Fed can cut rates again and markets are widely anticipating that already, with CME Fedwatch showing a whopping 99.1% probability of at least one 25 bp cut by the end of the year and a 88.3% chance of at least two 25 bp cuts.
For this to happen, subdued inflation feels a necessity and we’ll get the next installment for one of the key inflation metrics tomorrow morning with CPI and Core CPI.
CME Fedwatch Rate Probabilities to the End of 2025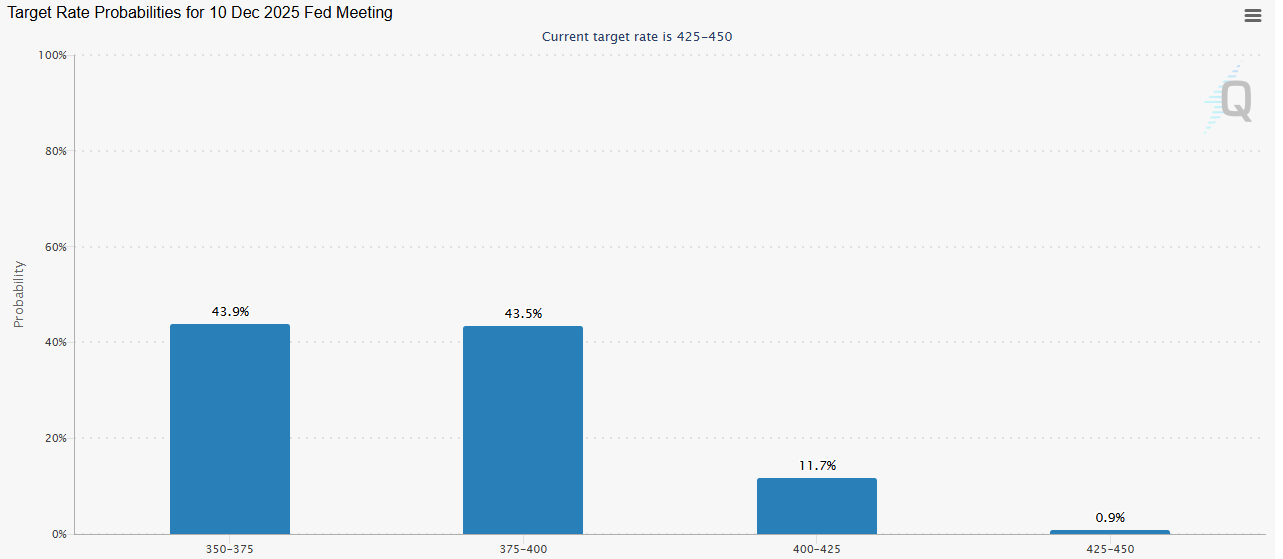
Chart prepared by James Stanley; data derived from Tradingview
EUR/USD in Response to US Rates
The September sell-off in the US Dollar helped to launch EUR/USD up to the 1.1200 handle, but that’s where EUR/USD bulls and USD bears suddenly stalled.
As both US rates and the USD pushed higher in Q4 of last year EUR/USD moved into a consistent and one-sided sell-off, with the pair eventually hitting a fresh low in the second full week of January alongside 10-year and 30-year Treasuries hitting high watermarks, at the time.
So, paradoxically, if we do see the Fed push rate cuts even as inflation remains high, this could be a driver of USD-strength as we saw last Q4. And, in-turn, that could be a driver of EUR/USD weakness especially given how aggressively bulls have pushed the pair so far this year as markets were priming for rate cuts, very similar to what we saw last Q3 with EUR/USD rallying ahead of the Fed’s start of the cutting cycle.
EUR/USD Weekly Price Chart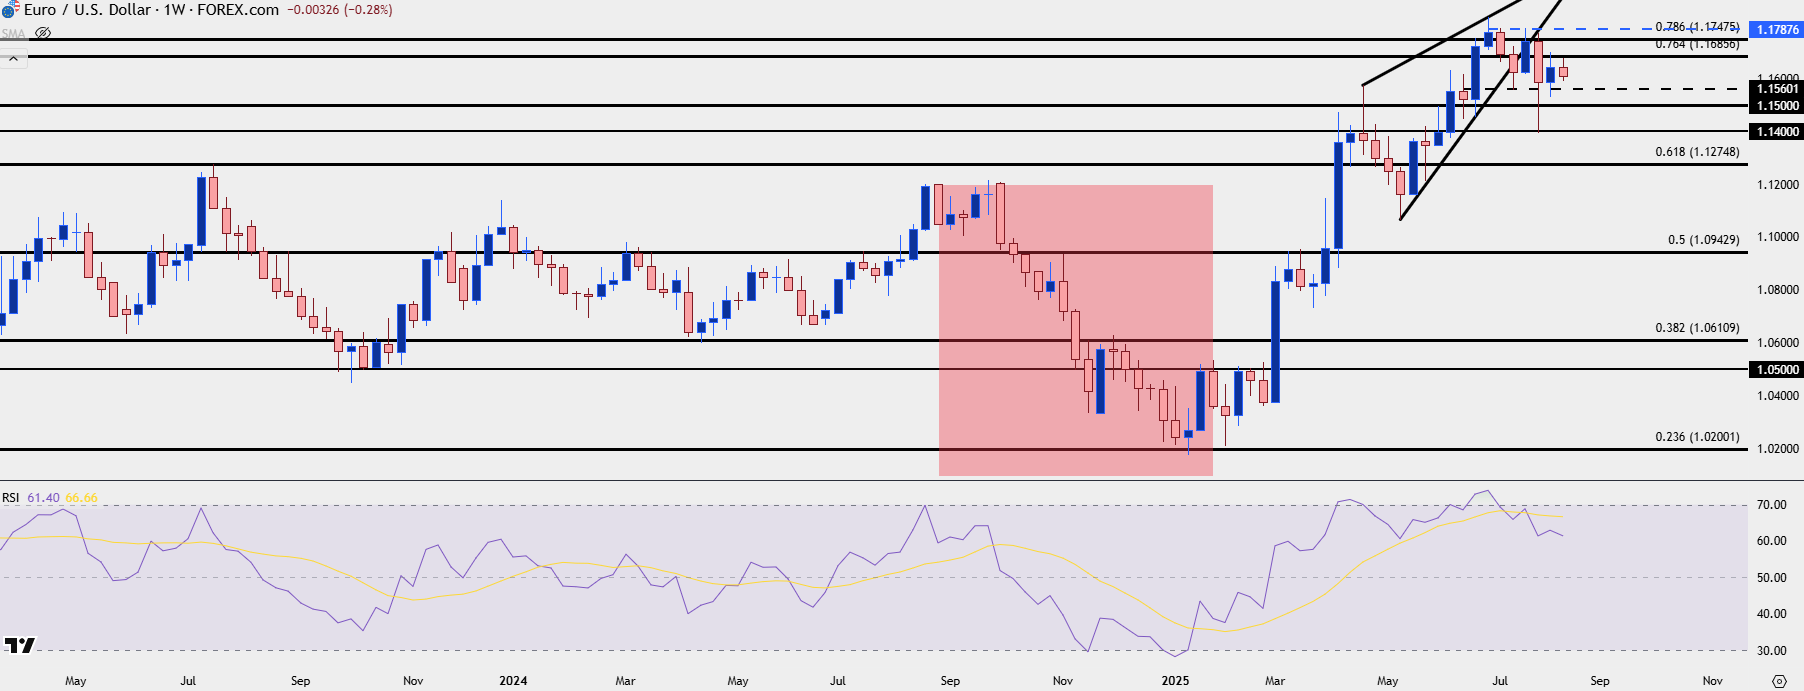
Chart prepared by James Stanley; data derived from Tradingview
EUR/USD Structure
I’ve written and talked a lot about the Fibonacci retracement produced by the 2021-2022 major move. I published an educational article on Fibonacci back in early-February, using this as an example and since then, the levels produced by that move have shown several interesting inflections.
Most recently, it’s been resistance at the 76.4 and 78.6% retracements, which remains in-play today. The former of those levels held the highs well last week, and price has since dipped down to a shorter-term support zone from 1.1573-1.1593.
EUR/USD Daily Chart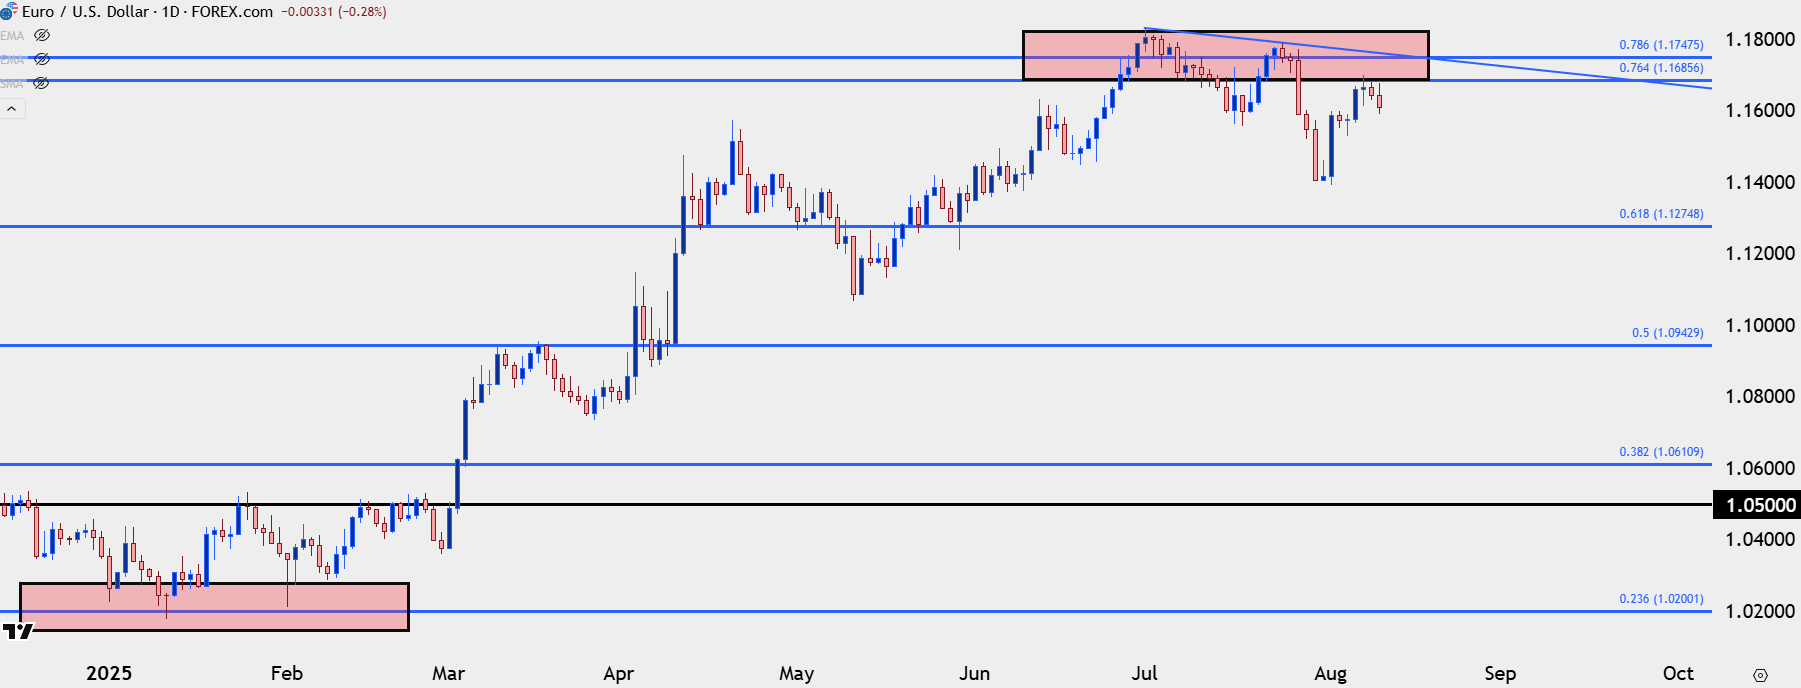
Chart prepared by James Stanley; data derived from Tradingview
EUR/USD Near-Term Strategy
At this point I remain of the mind that EUR/USD is one of the more attractive FX pairs for USD-strength. The US Dollar has so far held a big spot of support at the 98.00 handle, but key as to whether that pushes into a higher-high is tomorrow’s CPI print.
For strategy, however, I will look to price structure as a guide, and given the resistance hold at 1.1686 last week that’s the line-in-the-sand that sellers need to defend to keep control of the short-term move. Above that, the 78.6% retracement plots at 1.1748 and that can be considered as ‘r2’ or secondary resistance.
For support, it’s all about the 1.1500 handle which, so far, bulls have defended. We did get a test below that after the Core PCE print with inflation looking strong ahead of the NFP report and that helps to provide some structure on the way down.
Current support plots from 1.1573-1.1593, after which the 1.1524-1.1543 zone comes into play. Below that, there’s a shorter-term Fibonacci level of interest around 1.1450 and then the July/August swing-low at the 1.1400 handle.
EUR/USD Four-Hour Price Chart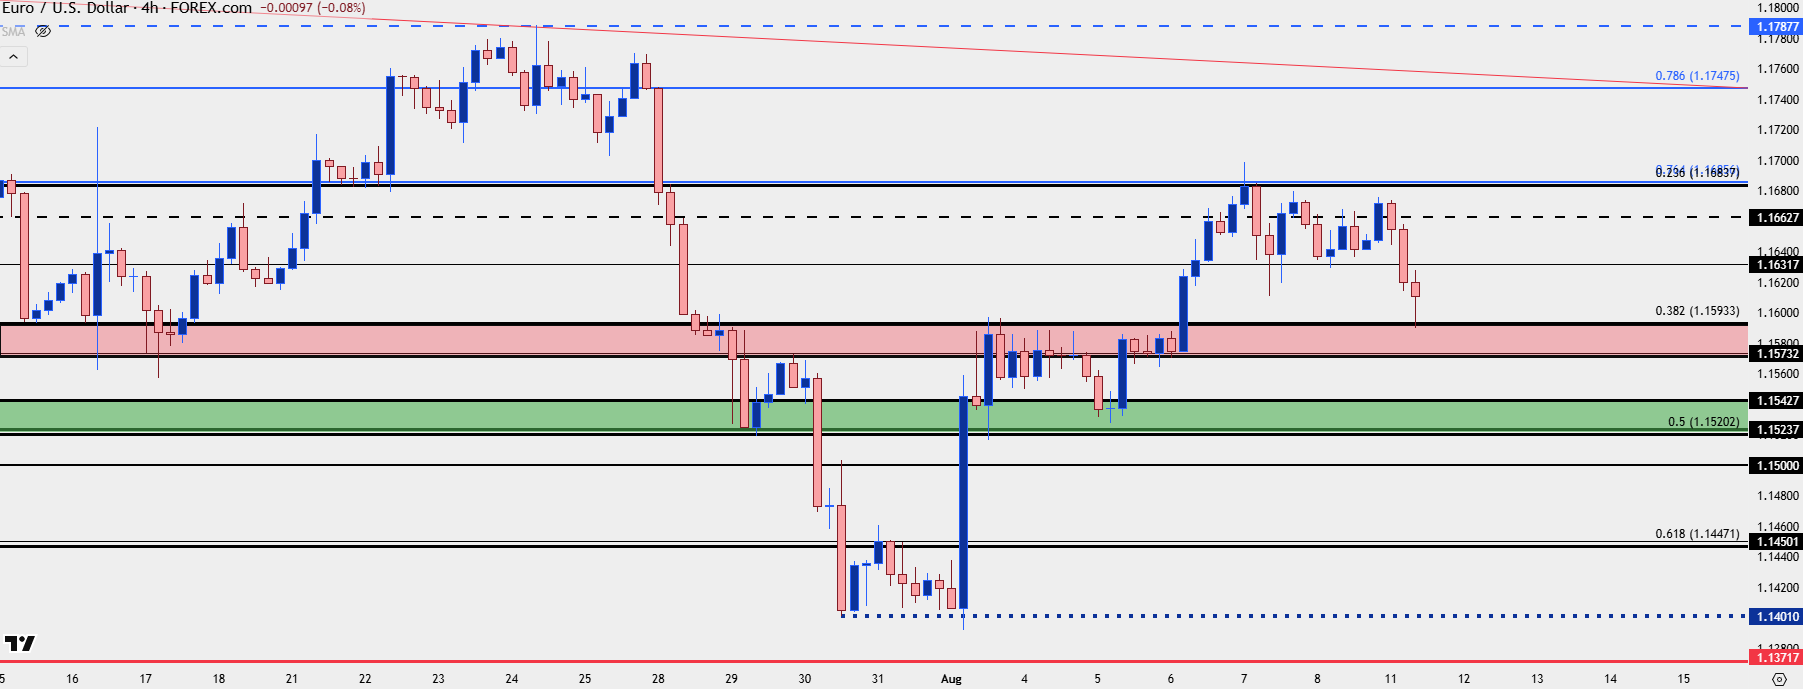
Chart prepared by James Stanley; data derived from Tradingview
— written by James Stanley, Senior Strategist