EURUSD, GBPUSD Outlook: ISM PMI and Rate Cut Bets
August 5, 2025 12:14Key Events
- Labor market and economic growth concerns support the case for a 25-bps rate cut by the BOE on Thursday.
- EURUSD’s latest uptick is challenged by the 1.16 resistance, tariff risks, and key US economic data.
- GBPUSD’s recent bounce is facing resistance at 1.330 ahead of the BOE meeting.
While the DXY’s rebound faces resistance from labor market concerns, the 100.20 technical ceiling, and increased Fed rate cut expectations, signs of positive trade deals could confirm the broader uptrend—especially as price action often leads headlines. The DXY still holds firm from the 96 support and its 17-year trendline, posing downside risks to the EURUSD and GBPUSD charts.
GBPUSD may have more downside potential given dovish expectations for Thursday’s BOE meeting, coupled with labor market and growth concerns—evidenced by two consecutive negative GDP prints at -0.3% and -0.1%.
As for EURUSD, tariff risks continue to cloud the outlook, particularly with Trump’s escalated trade demands and extended deadlines for renegotiations.
Technical Analysis: Quantifying Uncertainties
EURUSD Outlook: Daily Time Frame – Log Scale
Source: Tradingview
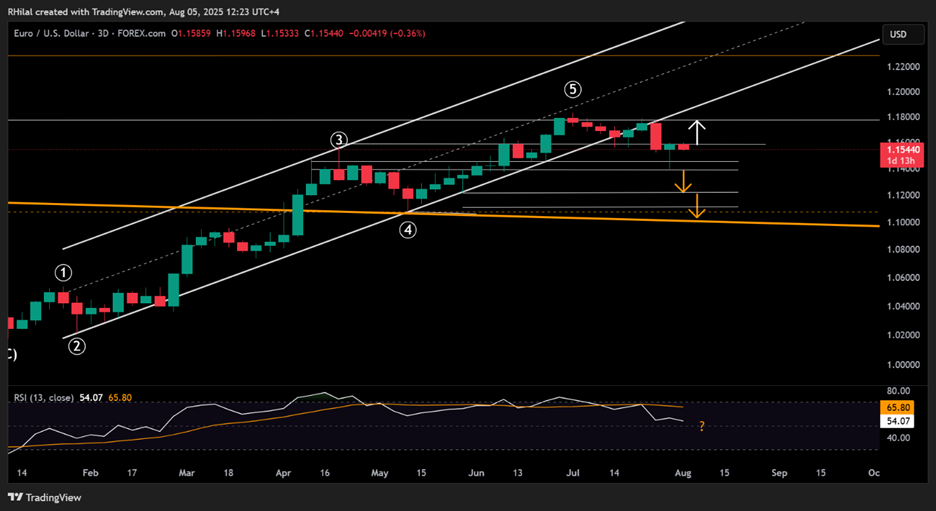
In line with the DXY’s pullback below the 98, the EURUSD jumped near the 1.16 resistance, the 50% Fibonacci retracement of the 3-legged correction from the 2025 peak, where it is facing another drop-down risk for another 3 legs down should the trend not confirm a clean close above 1.16. My scenarios are the following:
Bearish Scenario: a clean hold below 1.1450 can extend losses back towards 1.1380 where it can hold the trend or make way for a deeper drop towards 1.12.
Bullish Scenario: a clean hold above 1.16 may extend gains back in the direction of 2025 peaks near 1.1680 and 1.1770 before extending new 2025 records.
GBPUSD Outlook: Daily Time Frame – Log Scale
Source: Tradingview
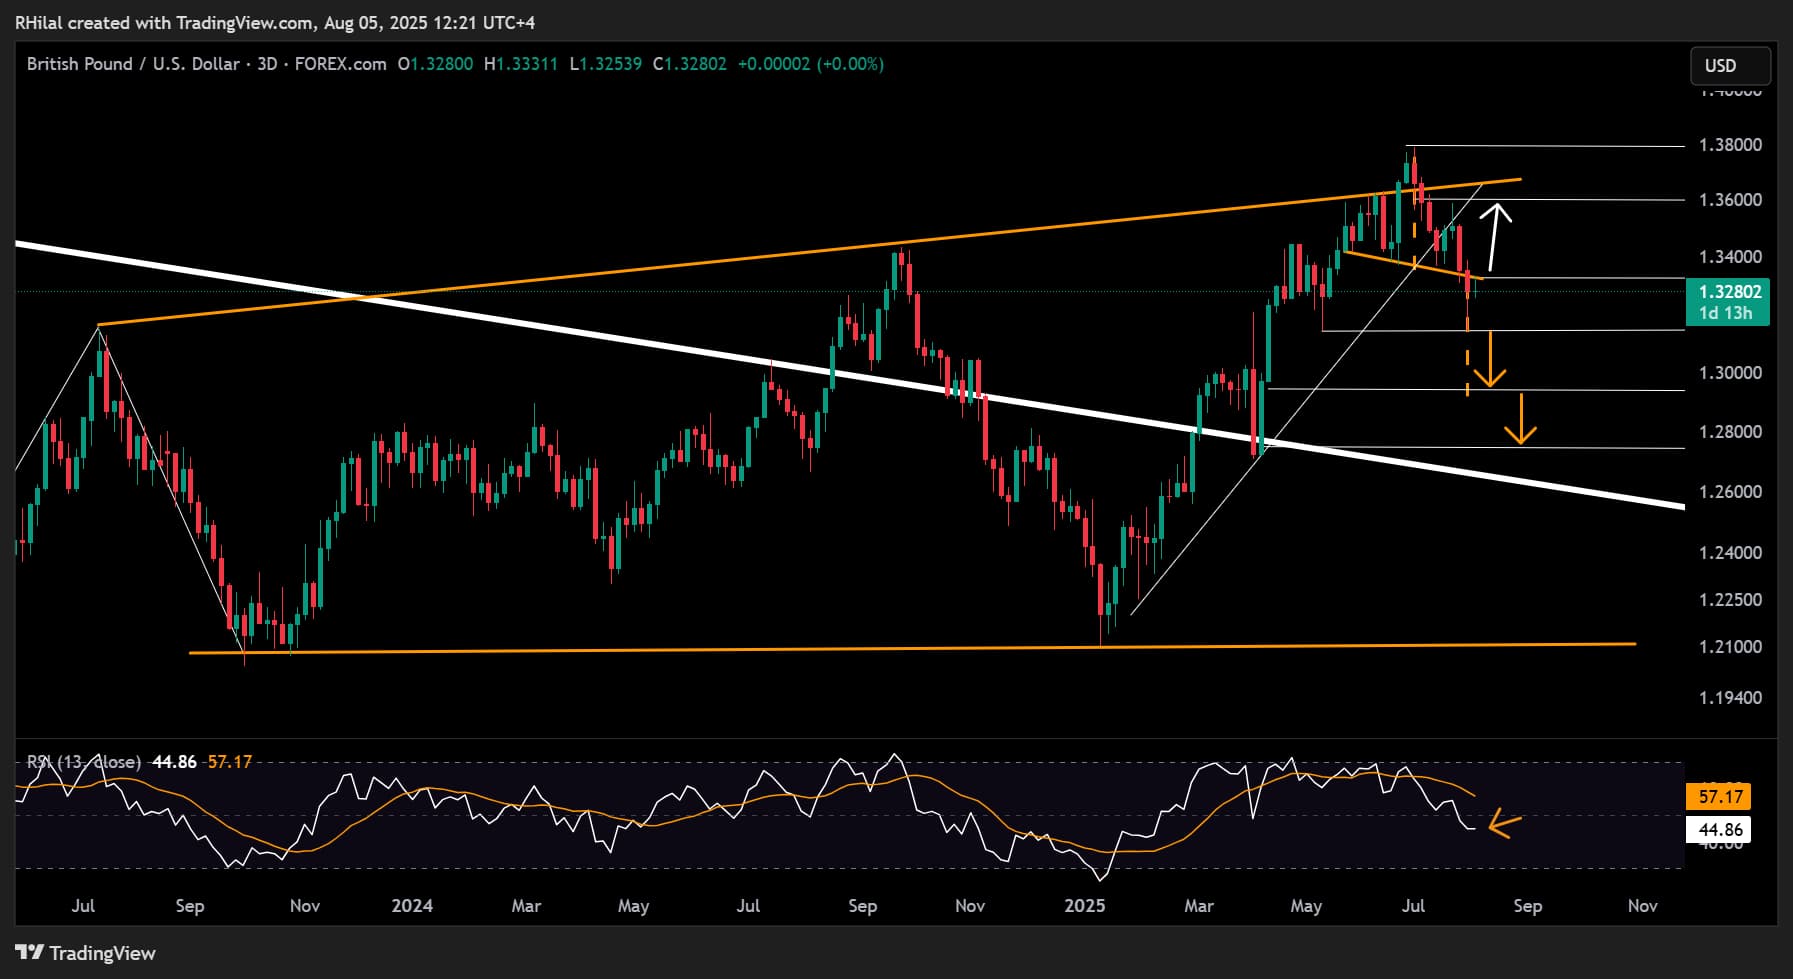
The GBPUSD chart setup is also currently positioned in a bearish structure. It continues to trade below the trendline connecting peaks from July 2023 to September 2024 with the 3-day RSI below the 50 barrier. Additionally, it recently broke below the neckline of a potential head and shoulders pattern, now testing the midpoint target at the 1.3140 support.
Should a decisive close occur below that level, the pattern could continue unfolding toward the next support at 1.2940. Further weakness may follow towards the trendline connecting lower peaks since 2008 (near 1.2740) is the 1.2940 level fails to hold.
On the upside, if the pair closes firmly above the neckline and clears the 1.330 resistance, gains could extend toward key 2023–2024 resistance levels at 1.36 and 1.38, potentially paving the way for new 2025 highs.
Written by Razan Hilal, CMT
Follow on X: @Rh_waves