Gold Price Forecast: Gold Pullback Cuts Short After NFPs
August 2, 2025 21:00Gold, XAU/USD Talking Points:
- A strong rally developed in the USD around the FOMC rate decision and that brought a pullback to gold, but it didn’t last for long as a big miss in the NFP headline number drove a sell-off in the Dollar and a rally in gold.
- Gold prices have been coiling for most of the month of July and this is something that can present both a bullish and a bearish case, depending on perspective, investigated below.
- I look at gold in-depth during each weekly webinar and you’re welcome to join the next. Click here to register.

The past three months have largely been a wash for gold trends, and this is something that can be argued as both bullish and bearish. On the bullish side, this three months of digestion comes after a massive topside move that spanned more than 75% in 15 months. Normally, a move of that nature would lend itself to pullback as longs take profit. This is where Fibonacci retracements can come in as handy, as traders can then gauge how bullish buyers remain to be, depending on where they re-enter to hold support.
From that perspective, an optimistic argument can be mustered as May brought a 23.6% pullback but since then, support has been holding at the 14.4% retracement which has helped to hold the low for the past two months.
The bearish argument, however, can be supported by the fact that bulls haven’t exactly done much with this hold of support even as the USD was melting down into the Q3 open. I’ll get deeper into that below.
Gold Monthly Price Chart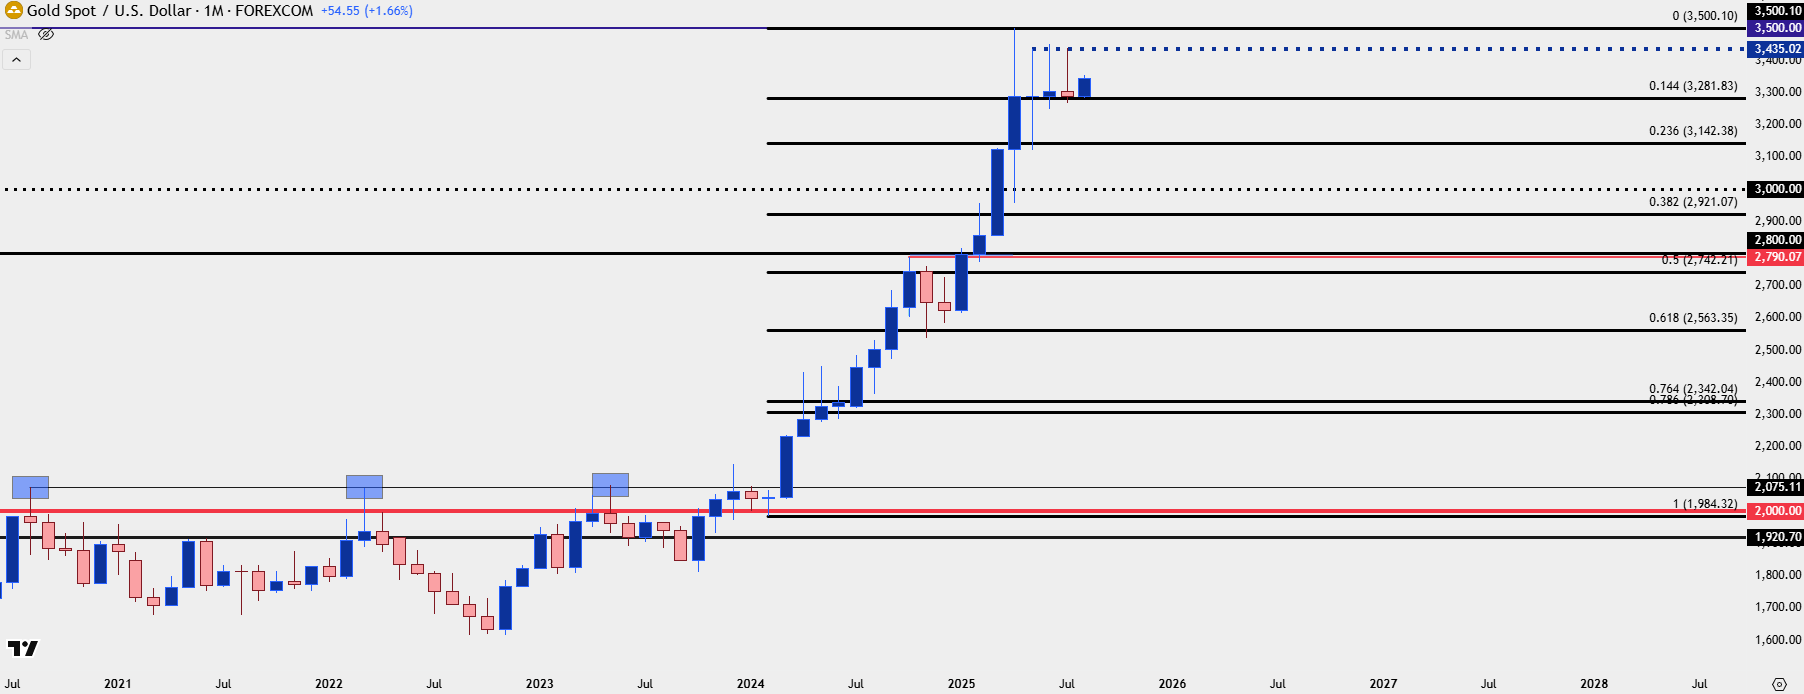
Chart prepared by James Stanley; data derived from Tradingview
Gold Weekly
Deduction is an important aspect of market analysis, because when something should’ve happened and it doesn’t, there’s probably a reason for it. And that reason may be highlighting what’s around the next corner. This doesn’t always spell for change but it certainly can, and that’s why traders are often best served to acknowledge these factors and, at the very least, consider the alternative scenario.
In this case bulls have had an open door to make a run at highs in gold and, so far, they’ve been unable to get back up to the $3500/oz water mark that was set in late-April. There has been a continued hold of lower-high resistance at $3435, with three separate instances of tests. And on the bullish side of that argument, there’s even a case to be made for higher-lows, as the May low of $3150 led to the late-May and June low of $3250.
And then after the most recent $3435 test, another higher-low has shown up, so far, with price reverting back for a resistance test at $3350.
The challenge here is the other side of the XAU/USD quote and that’s the U.S. Dollar. The USD initially showed a strong breakout earlier in the week, driven by both inflation and the FOMC meeting, when it didn’t sound like we’d be seeing rate cuts anytime soon. But perhaps more worrying for gold bulls is that as the Dollar was dropping into the Q3 open, gold prices had been falling into that second $3250 test. This illustrates a still frothy market after the 75% rally in 15 months, which can be argued lends itself to greater pullback potential, especially if we see USD bulls continue the trend.
From the weekly chart below we can get better view of that coiling price action that’s been building since early-July.
Gold Weekly Price Chart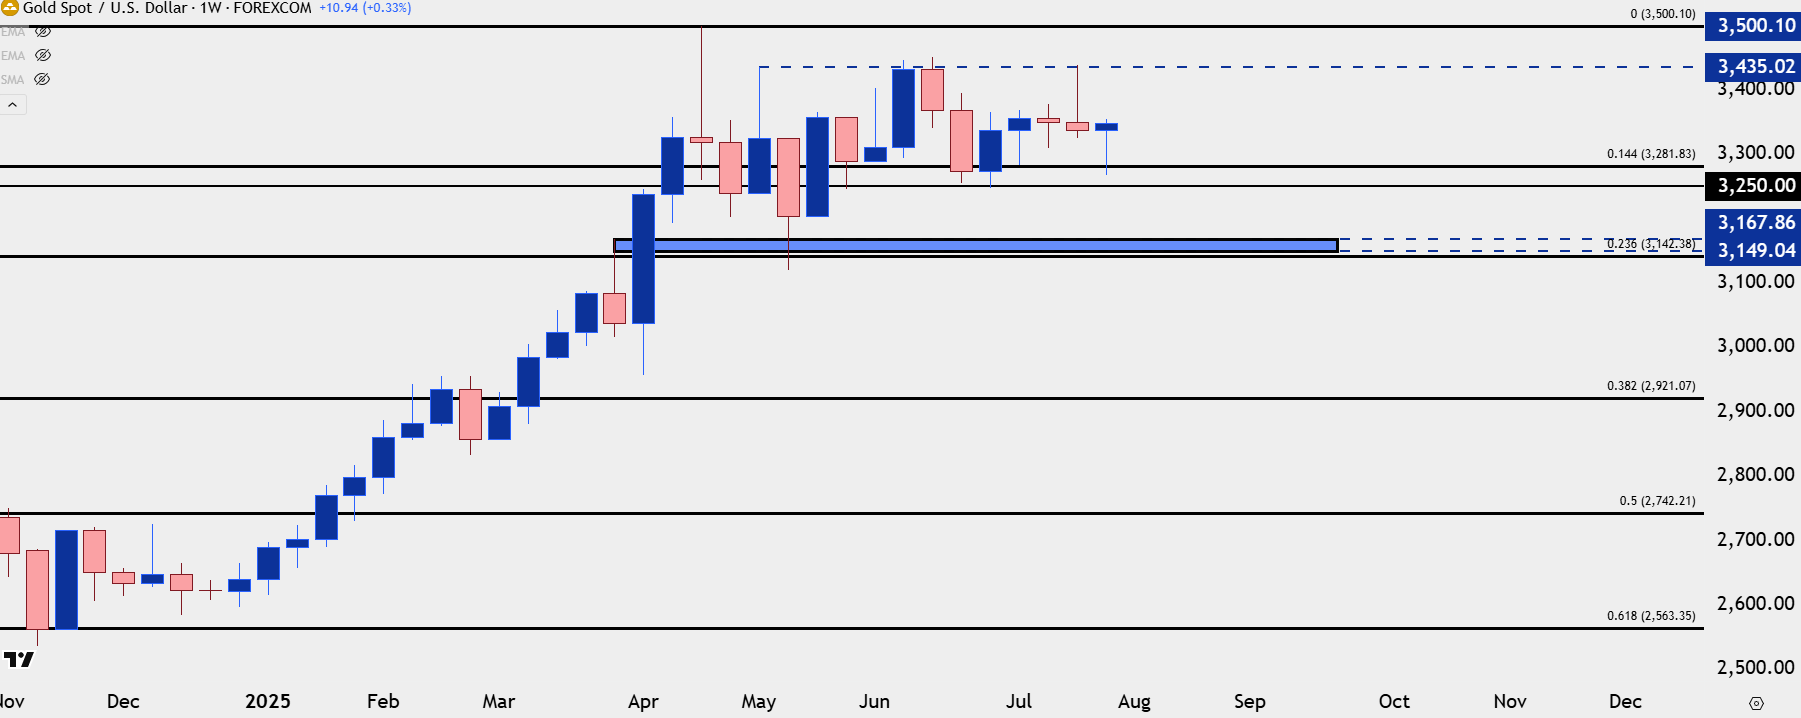
Chart prepared by James Stanley; data derived from Tradingview
Gold Daily
I’ve been saying in webinars for some time that I’m not too interested in bearish scenarios in gold, and one of the big reasons is just how resilient the trend has been. Episodes such as we saw in May, when gold prices were coming off quickly but bulls wouldn’t even allow for a re-test of the $3k level, or like we saw in the final two months of last year as gold prices built in a bull pennant formation.
To be sure, the longer-term trend remains overbought with RSI on the monthly chart still in elevated territory. But that doesn’t mean that the trend has to show a full-fledged reversal; and, instead, traders can look for pullback potential until greater evidence of a larger reversal presents itself.
At this point, the move in gold is tough to chase-higher, with price testing both the underside of a bullish trendline and the $3350 level. But there’s support potential at $3300 which could function as a higher-low. If we do see a deeper pullback, driven by profit taking from the longer-term bullish move, then $3250 remains a viable area of support potential, as does the $3200-$3205 zone.
Perhaps the more exciting scenario for buyers is that next test of $3435, but before that can come into play, there’s a spot of resistance around $3375 that’s of interest, and a test there, particularly if it happens quickly, opens the door for support at $3350.
Gold Daily Chart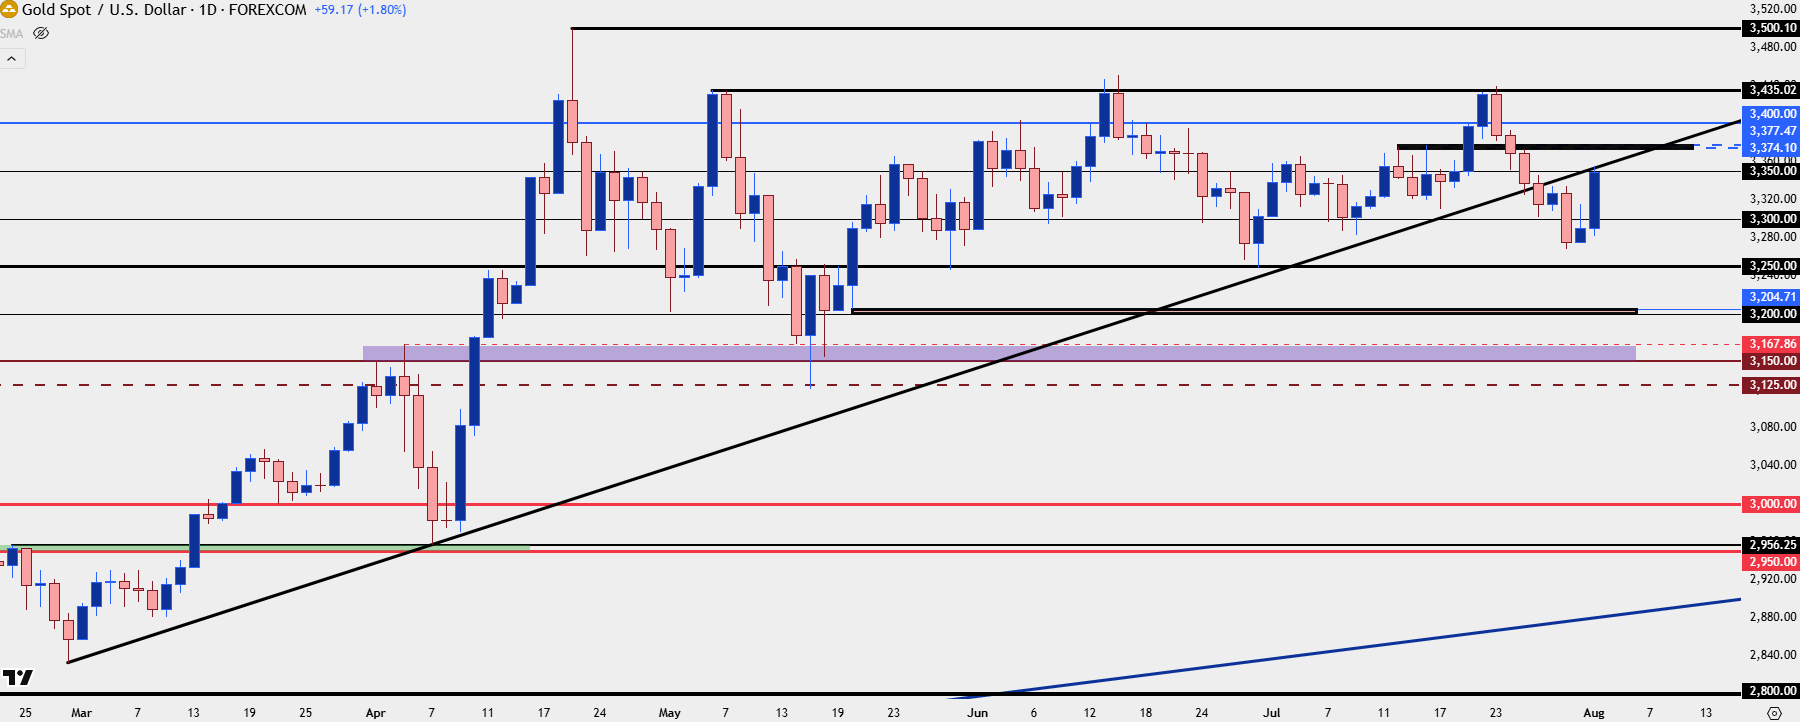
Chart prepared by James Stanley; data derived from Tradingview
— written by James Stanley, Senior Strategist