U.S. Dollar Price Action Setups: EUR/USD, USD/JPY, GBP/USD, USD/CAD
August 1, 2025 21:52U.S. Dollar Talking Points:
- The U.S. Dollar completed July as its strongest month in more than three years, and then put in a sizable sell-off on the back of Non-farm Payrolls data.
- It was such a busy week in the USD that it will probably take more time for trends to present itself, but at this point the Dollar is holding support at a big spot of prior resistance on the chart.
- The big question now is whether the Fed will be cutting rates in September. Powell didn’t sound too optimistic on that front, and he highlighted the importance of the unemployment rate as a gauge of labor market health, which remained at 4.2% in Friday’s report. But – the headline number and the revision to headline numbers from prior months is what really got attention, driving the largest single-day sell-off in the USD in more than three months (as of this writing).
The true test of a trend isn’t what happens in the breakout – it’s what happens in the pullback. I feel like I’ve said this phrase hundreds of times in webinars and videos over the past couple of weeks but in my opinion trends are a lot like people, you don’t judge their true character in the easy times, when things are ‘good.’ It’s what happens in the tough times that shows you who someone, or a trend, truly is.
A good trend will have that two step forward, one step back type of motion. Buyers will show up to bid higher-lows, and this can often show around prior resistance. If they don’t, well then the optimism that drove the breakout and the higher-high isn’t really there and, instead, sellers are using that prior rally to sell in at a better rate.
That’s where we’re at with the USD and this goes right back to what I had noted in last weekend’s USD article, where a batch of headline risk as deep as we just saw can create new trends. Well, the question now is whether that can stick.
The USD launched a decisive rally on Monday and that continued through Thursday, with price finally testing the 100-level in DXY. We even had extension of that move into Friday morning, when price ultimately found resistance at the low from last Q3 of 100.22.
But a nasty NFP report brought sellers back into the mix and much of the Wednesday and Thursday rally was erased as USD pushed back for a re-test of the 98.98 Fibonacci level.
Parsing through that report, it was really the drastic revisions to prior months that got attention. Just a few days earlier at the FOMC meeting Jerome Powell said that it was the unemployment rate that mattered most, and that printed right at the expected 4.2% which Powell had said was close to full employment. But that didn’t stop markets from reversing the Fed-fueled gain in the Dollar and as of this writing, DXY is testing support at prior resistance.
U.S. Dollar Daily Chart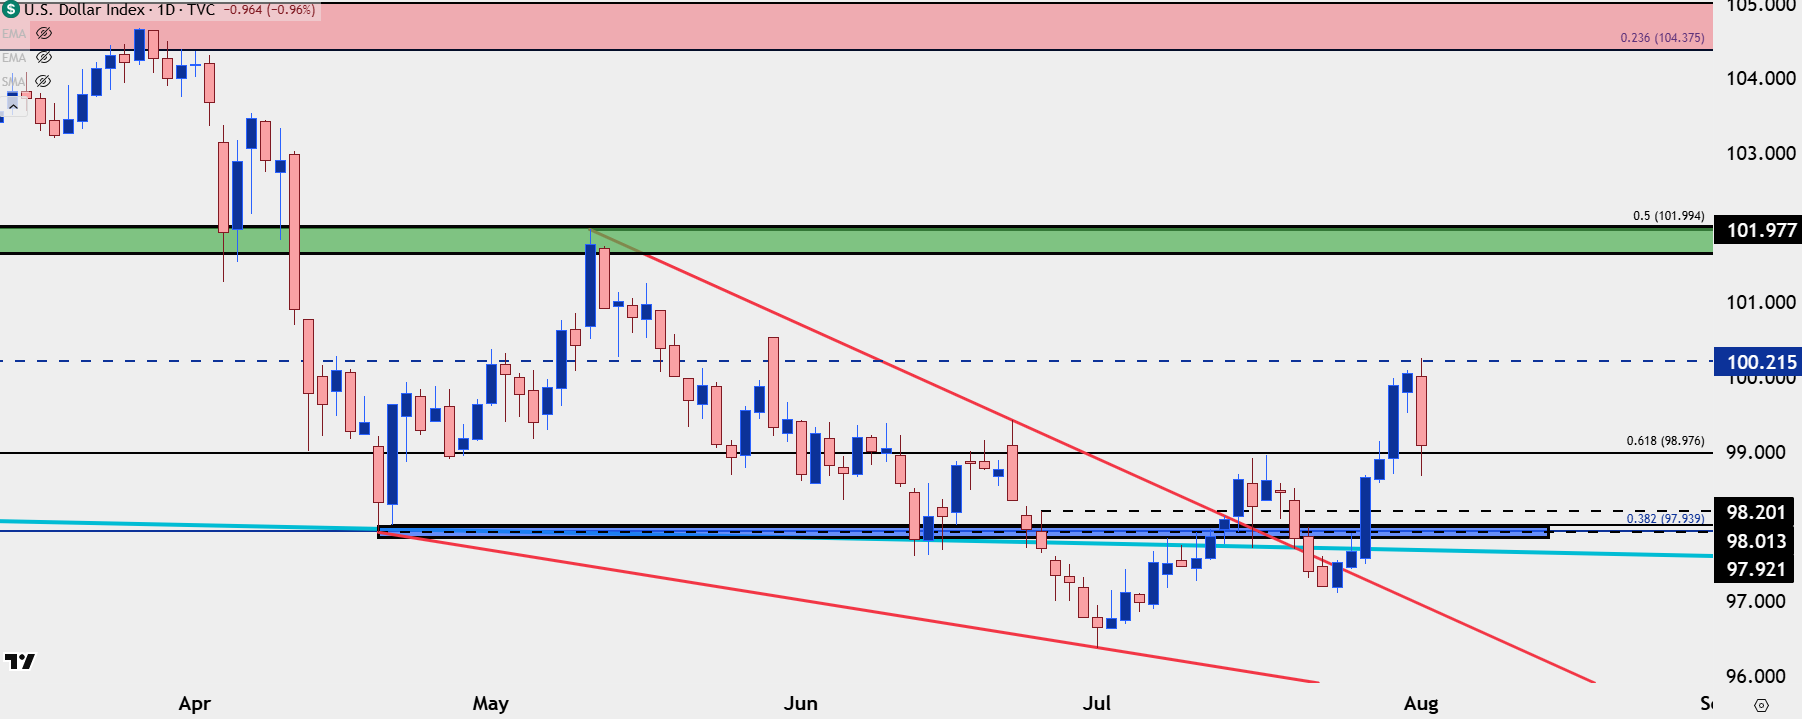
Chart prepared by James Stanley; data derived from Tradingview
USD: From Feast to Famine
The rally on Thursday allowed for the USD to finish the month of July as it’s largest single-month gain since April of 2022, which was just after the Fed had started their rate hike cycle after ignoring inflation for much of the prior year, saying it was ‘transitory’ and supply-chain related.
But there’s a big difference here as that move was driven by higher rate expectations around the Fed, and the current rally, the bulk of which built over the prior week, was driven by rate cut bets coming off or being pushed out into the future.
There’s also the matter of positioning to consider as the USD sell-off had persisted for most of the first-half of the year with oversold readings showing via both weekly and daily RSI as we walked into Q3 trade. That has come off quickly as we saw the rally develop and as noted above, the true test of trend here isn’t necessarily what happens at highs as much as what happens at lows.
Will USD bears still be willing to punch price through supports? That’s what has so far changed in Q3, such as we saw with the prior higher-low in the week before last week.
There’s also the matter of counter-parts to consider, as both USD/JPY and EUR/USD had quickly moved into extremes ahead of the Friday sell-off. Both pairs were showing overbought or oversold readings after a short-term rally and those are difficult backdrops with which to chase a move, especially when a negative NFP report printed like we saw on Friday.
In the USD, the weekly chart illustrates this recent grind well, as sellers have been rebuffed with higher-lows even as buyers faced a sizable late-week pullback after NFP on Friday.
U.S. Dollar Weekly Chart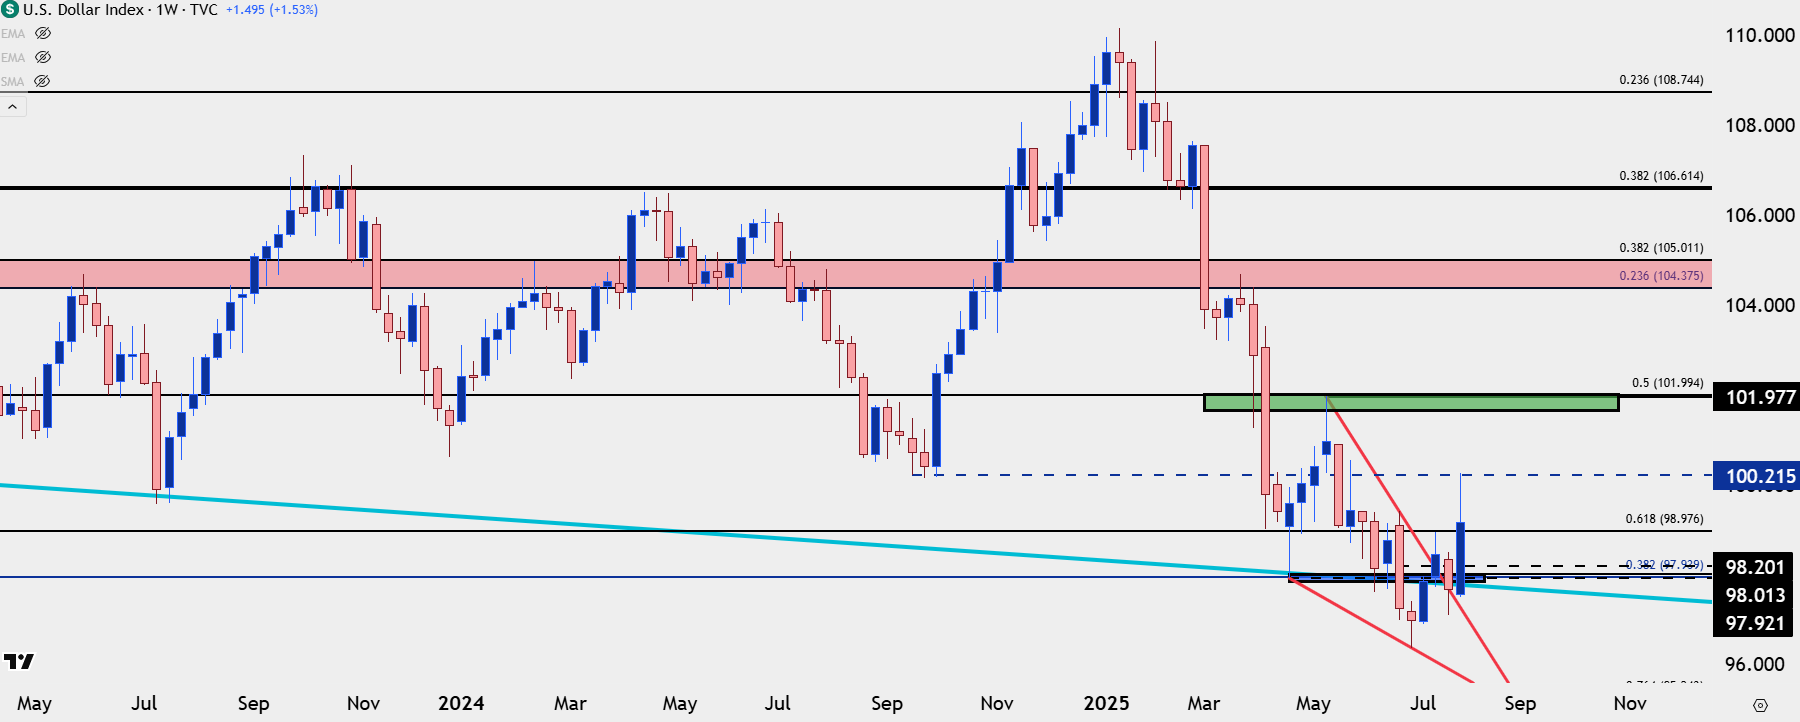
Chart prepared by James Stanley; data derived from Tradingview
EUR/USD
EUR/USD showed an aggressive sell-off around the FOMC rate decision with RSI going deeply into oversold territory, with a low of 20.10 on the four-hour chart around that rate decision. A move that strong is simply hard to chase lower, and this what explains the stalling that showed on Thursday even as the Dollar continued higher (helped in large part by USD/JPY, which I’ll look at next).
It was the 1.1400 handle that set the lows for EUR/USD before the Friday pullback, which 1.1560 coming in to set the highs.
EUR/USD Four-Hour Chart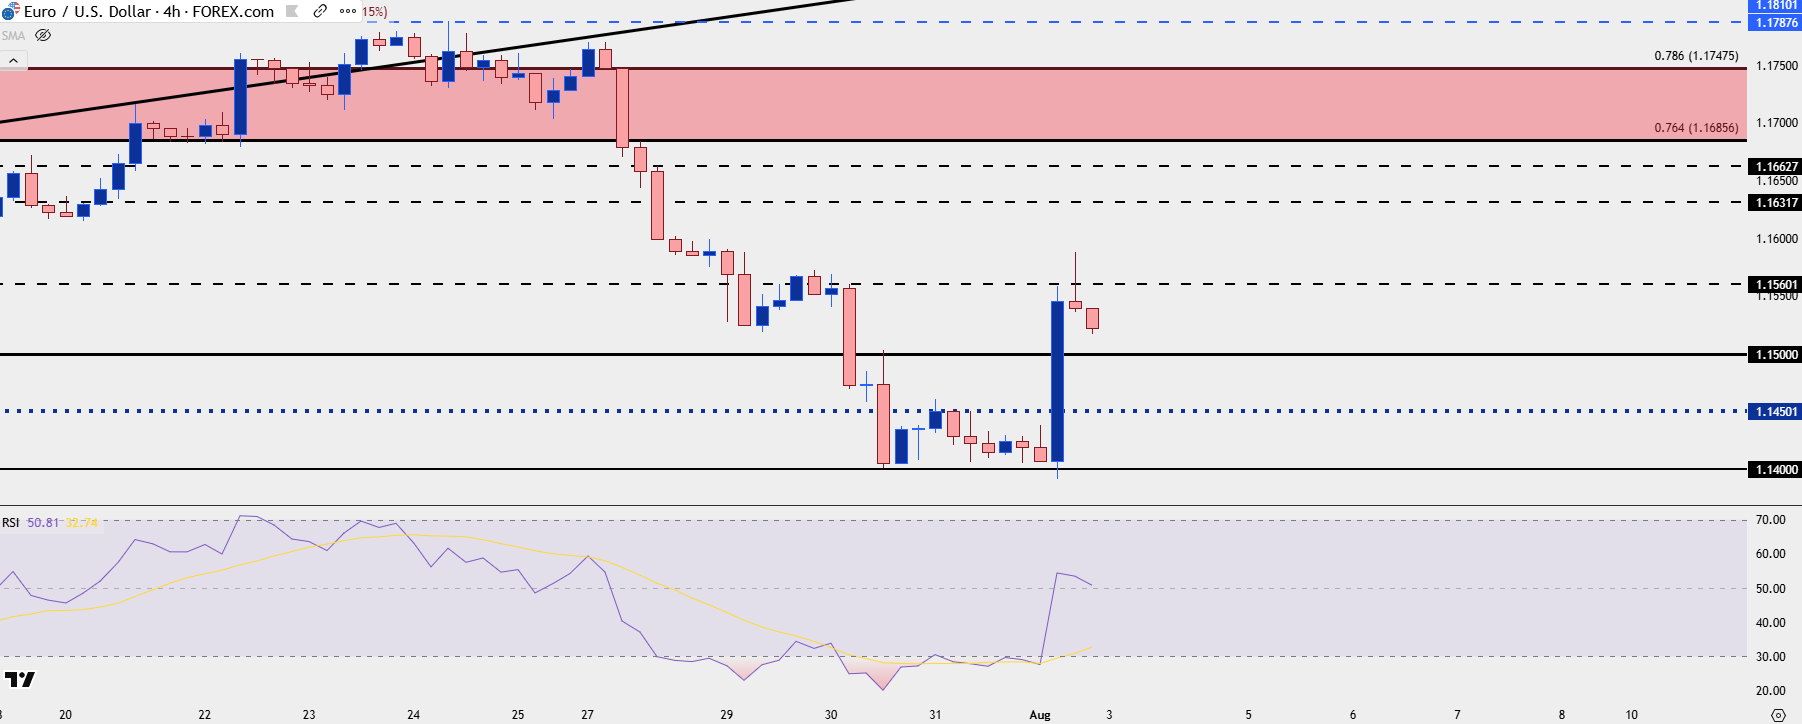
Chart prepared by James Stanley; data derived from Tradingview

EUR/USD Daily
The question now in EUR/USD is which trend will take over. From the daily chart we can still see a lower-low leading into a possible lower-high, with resistance taken from prior support.
As I said in the Tuesday webinar, the 1.1500 level is massive in the pair as this is a psychological level that doesn’t usually give way easily, illustrated by the April instance where the first test above led to a four-week pullback.
If looking for USD-strength, I think this is still one of the more attractive major pairs to be working with.
EUR/USD Daily Chart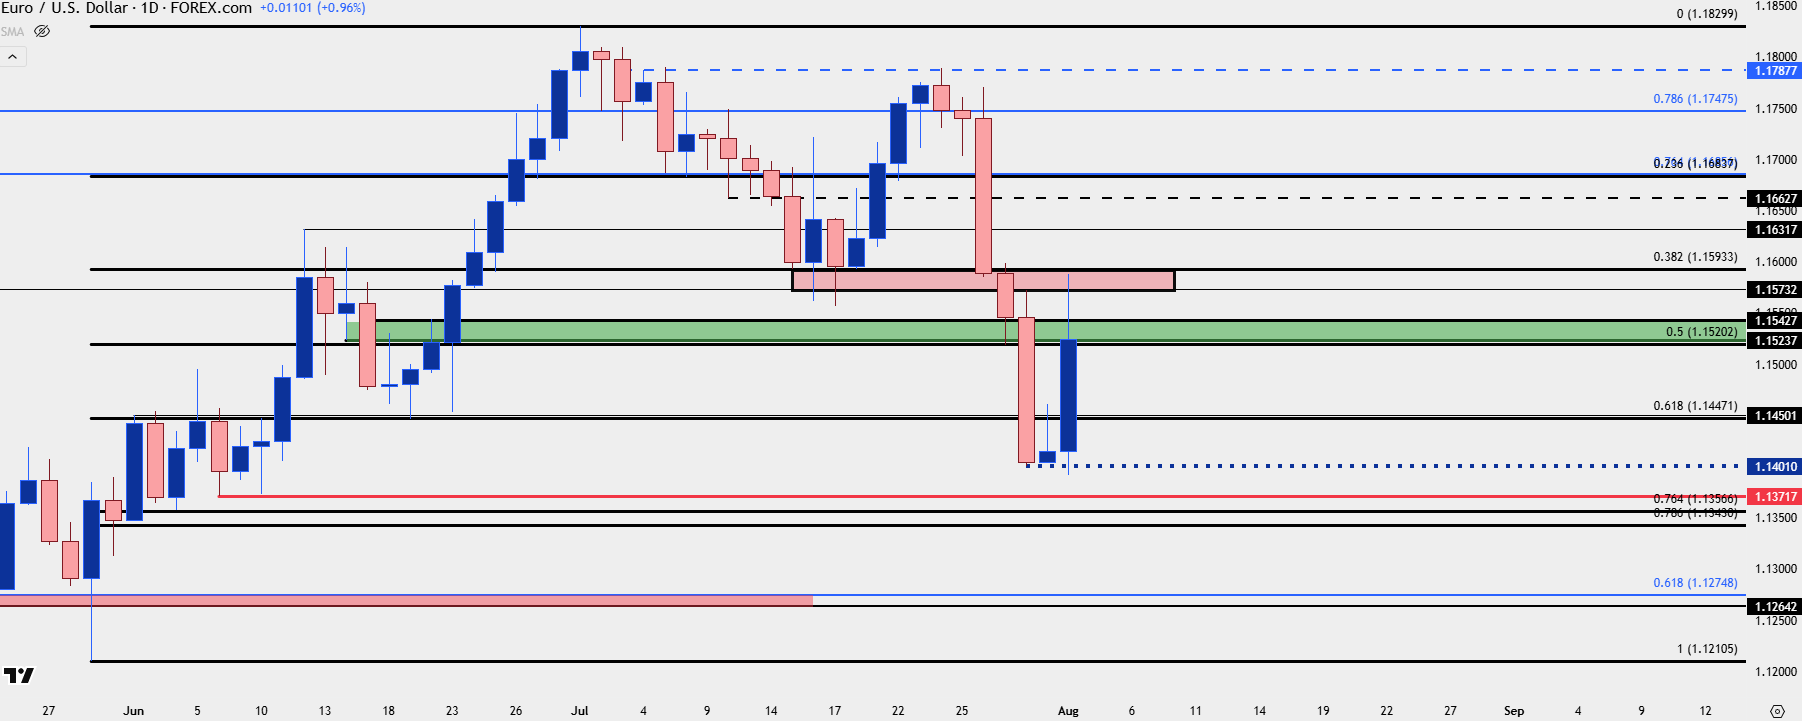
Chart prepared by James Stanley; data derived from Tradingview
USD/JPY
In the Thursday video and article on USD/JPY I cautioned around chasing the move. Price had just started to test a Fibonacci level at 150.77 and while RSI wasn’t quite overbought on the daily, the move was already very stretched. There was also multiple spots of support potential, none of which have been able to hold the lows thus far.
I think this remains a hot button for USD themes but given the massive volatility that we’ve just witnessed, it’ll probably take a day or two for trends to clear up next week. At this point, from the daily, it can still be argued as a pullback and a possible higher-low after a higher-high. Bulls re-taking 148.65 could be seen as an optimistic factor for topside trends. For support, it’s the 145.92 level that I was talking about a week prior that remains of note, and this is what buyers need to hold to retain topside potential.
USD/JPY has seemed to be especially prone to traps so far this year – on both sides – so breakouts remain an unattractive strategy for the pair, in my opinion. Pullbacks, however, can remain as viable and the big question now is whether bulls return after a massive move higher followed by a sizable sell-off.
USD/JPY Daily Chart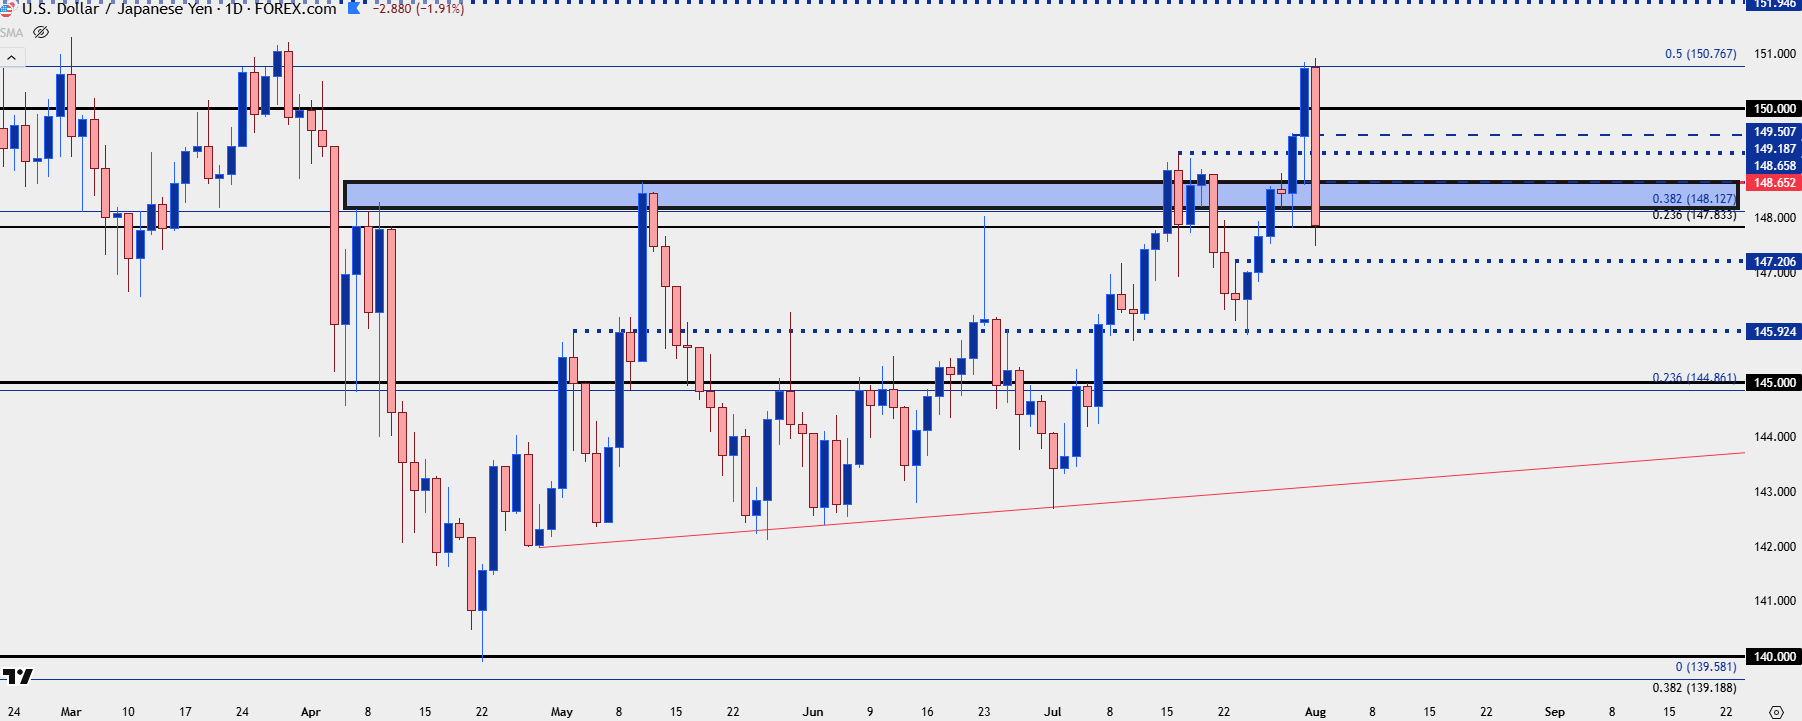
Chart prepared by James Stanley; data derived from Tradingview
GBP/USD
If looking for USD-weakness to return, I still like GBP/USD and there’s now a technical backdrop that could be of interest for that theme. The pair dropped all the way down for a re-test of the May low at 1.3145, which is also a spot of prior resistance.
As looked at in the video, the current setup in GBP/USD bears some similarity to what I had looked at in mid-July, also after a run of USD-strength and right around the time that President Trump threatened to fire Jerome Powell.

GBP/USD Four-Hour Price Chart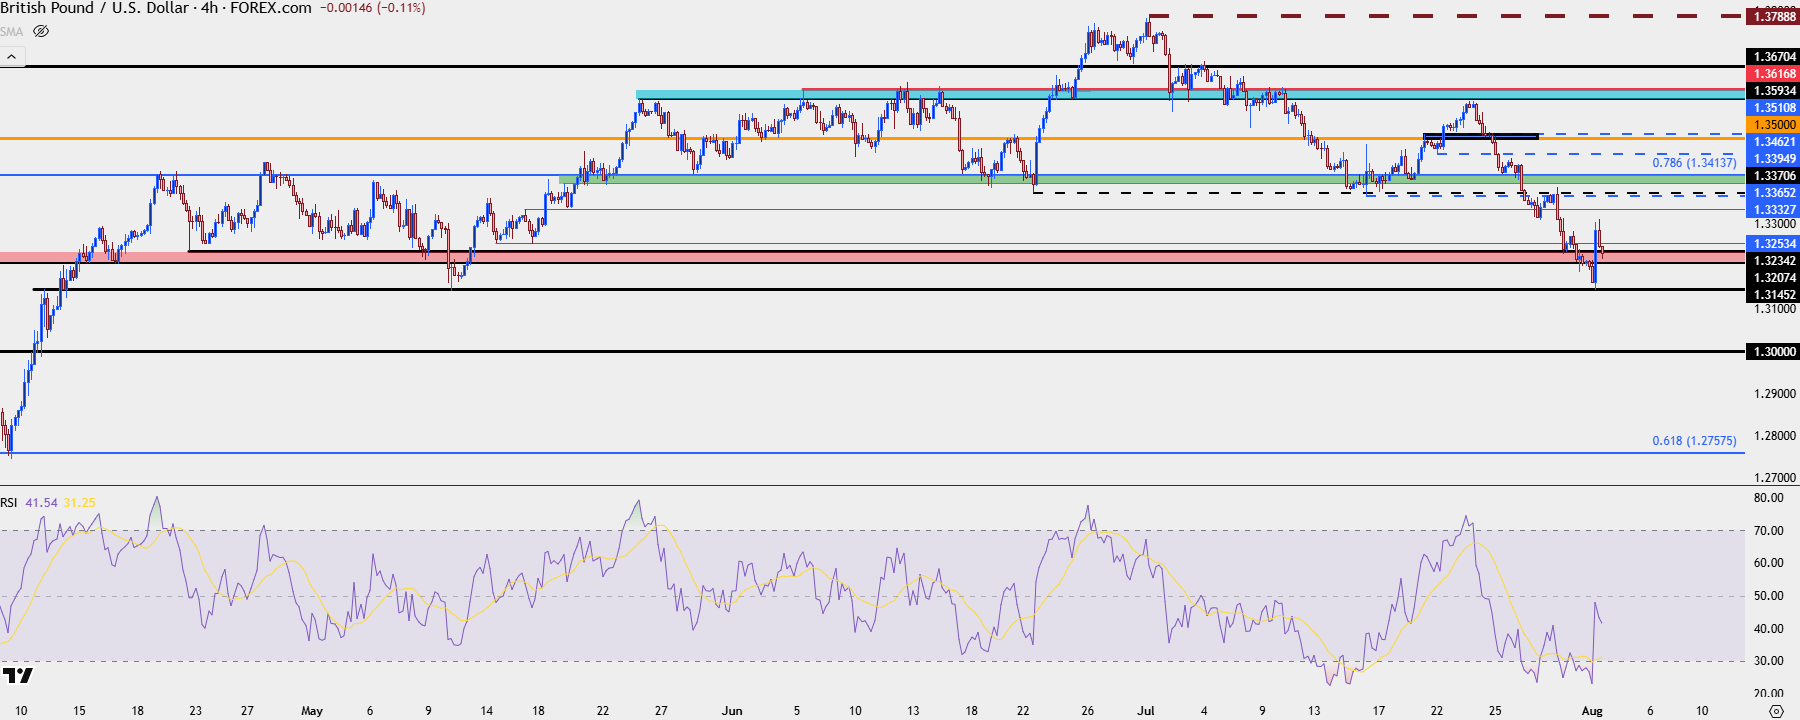
Chart prepared by James Stanley; data derived from Tradingview
USD/CAD
USD/CAD had broken out from an ascending triangle formation after the prior week hold of higher-low support at a trendline projection. The Friday bar is currently showing as a bearish engulf but given the wider context, this looks like a pullback from near-term higher-highs that keeps the door open for bullish continuation. For next week, the 1.3750 level remains key for that theme to remain in-play.
USD/CAD Daily Price Chart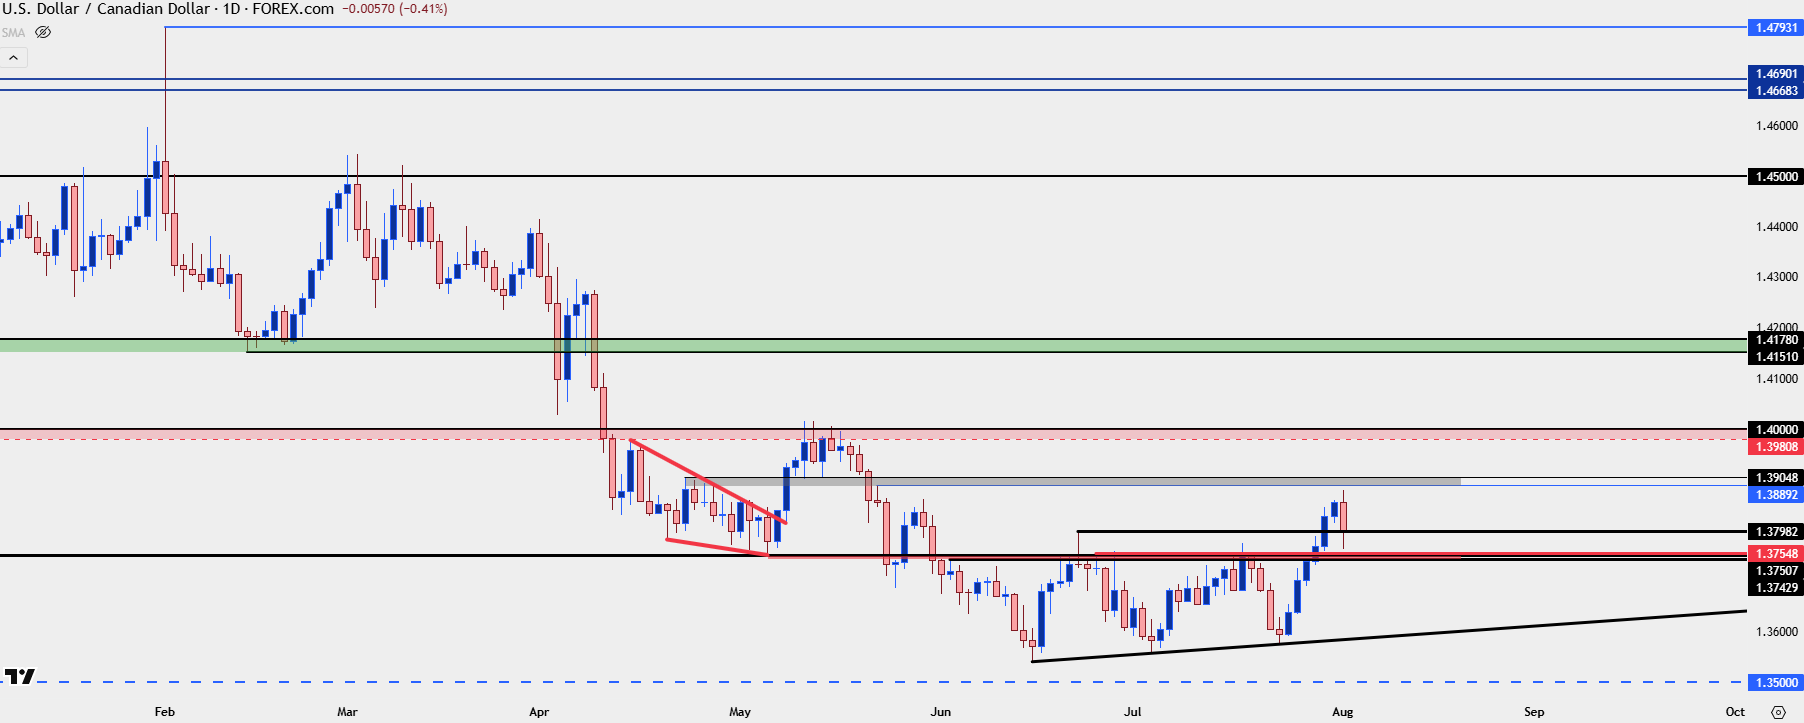
Chart prepared by James Stanley; data derived from Tradingview
— written by James Stanley, Senior Strategist