Gold Price Forecast: $3500 Casts a Shadow for XAU/USD
July 30, 2025 18:10Gold, XAU/USD Talking Points:
- Gold bulls haven’t quite retreated yet although the lower high at 3435 inside of the April high of 3500 gives the appearance of possible exhaustion following a 75% rally in 15 months.
- There have been pullbacks in gold but so far, buyers have shown up to offer support shortly after, such as the episode in May when support held above $3100 or in June and July when it held at $3250.
- The big question for today is whether the Fed might talk down rate cut hopes which could give more reason for traders to take profits on long gold positions.

The monthly chart of gold still looks pretty outlandish, if you ask me, as a parabolic move has developed over the past year and a half and there still hasn’t been much for pullback. The $2k level was a tough nut for buyers to crack as bulls pulled up just shy of a test there back in 2011, and then when finally did come into play nine years later it held the highs for three-and-a-half years before bulls could ultimately push above.
After that, however, the move was incredibly one-sided, with gold gaining more than 75% from the February low up to the April 2025 high. The new high printed at another psychological level of $3500, and since that came into play buyers haven’t been able to extend the move. This isn’t to fault bulls as they’ve continued to bid support, which has led to the indecision shown in monthly candles for May, June and now July.
Gold Monthly Price Chart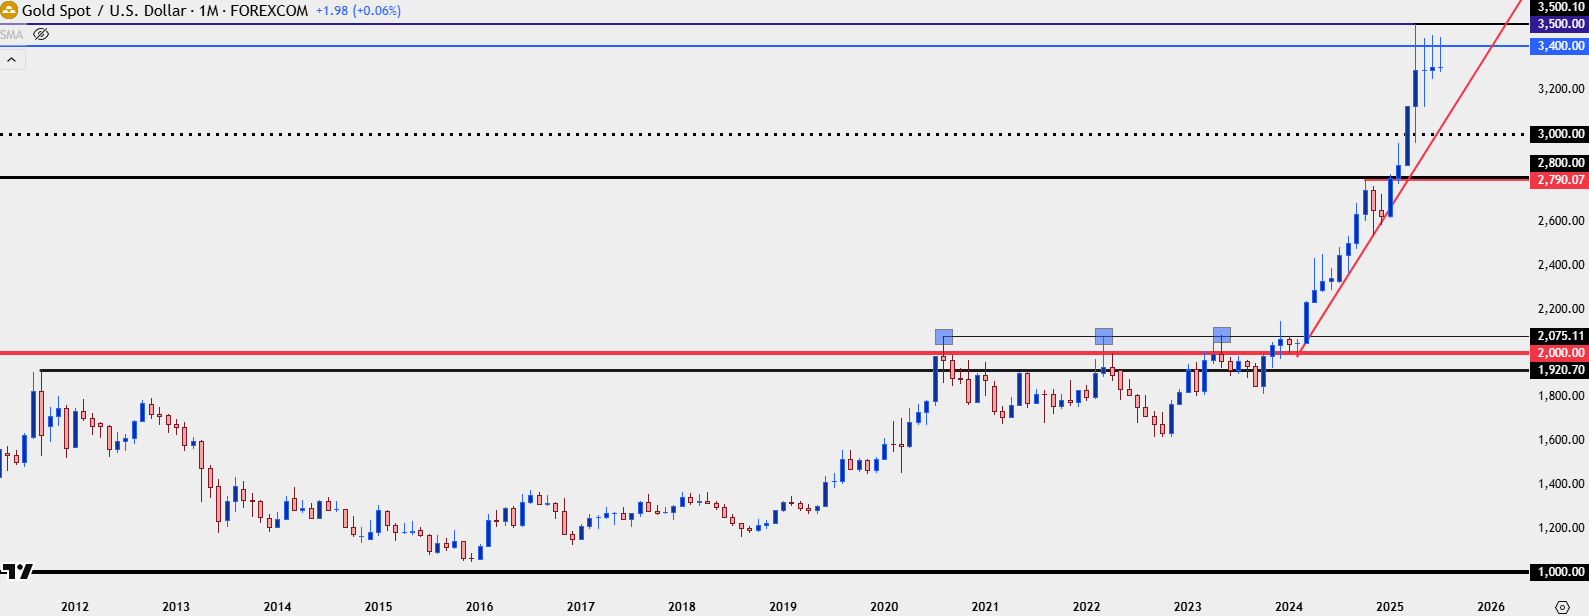
Chart prepared by James Stanley; data derived from Tradingview
Gold Weekly
The drama around $2k in gold can be illustrative as even getting close to a major psychological level of that nature can induce sentiment changes in the market. If it’s been a fast and drastic run and price suddenly stalls just short of a major level of that nature, it can encourage other longs that have ridden the trend to take profits, which can lead to supply and in-turn, lower prices.
While this didn’t inhibit buyers from marching up to $3500 in April, there has been building trepidation since with a lower-high developing at $3434. That held highs back in early-May, and at that point, it looked as though a deeper sell-off would commence. But – buyers stepped in at the $3150 zone of support taken from prior resistance, and by mid-June we had another test at that same $3435 level.
The pullback from that held yet another higher-low, and buyers then pressed up for a third test of $3435 in July which has similarly failed.
This isn’t to say that bulls are done for but it does highlight how a one-sided move is showing illustration of stall, and that can lead into larger pullback scenarios especially if there’s motive for profit taking from longs.
Gold Weekly Chart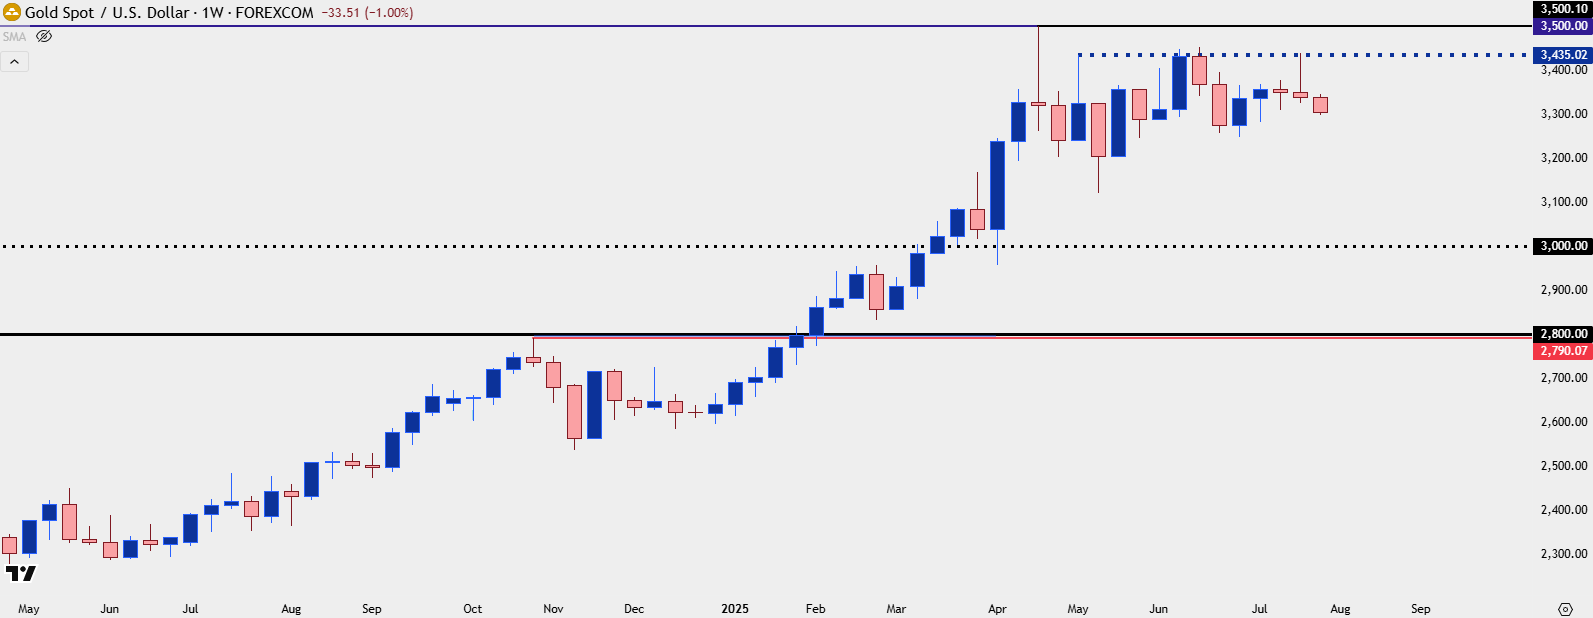
Chart prepared by James Stanley; data derived from Tradingview
Gold Daily
Until last Friday there was an active bullish formation in-play in the form of an ascending triangle. These formations involve horizontal resistance to go along with higher-low support, illustrating a diminishing marginal impact of that resistance which, eventually, can lead to a bullish breakout.
But that hasn’t happened here and instead gold has broken below the bullish trendline and retreated back to a test of $3300, going along with the wider swath of USD-strength ahead of today’s FOMC meeting.
Does this mean that the bullish trend is over? Not necessarily, although there could be building reason for longs to take profits which then puts the look to deeper support potential.
In gold the 3300 level is already in-play and in both May and June it was the $3250 level that held the lows well before bounces up to $3435. Both can remain viable for support, with the $3300 level needing a fast near-term reaction while $3250 could come into play after or around the FOMC/PCE/NFP events on the calendar for this week. Below that, there’s a zone from $3200-3205 that remains of interest, and below that is the area around $3150 that caught the lows back in May. Notably – that sell-off in May hit hard after the FOMC rate decision that saw the Fed sound less-dovish than markets were hoping for. And the big question remains as to whether the bank will sound dovish at the rate decision later today.
Gold Daily Chart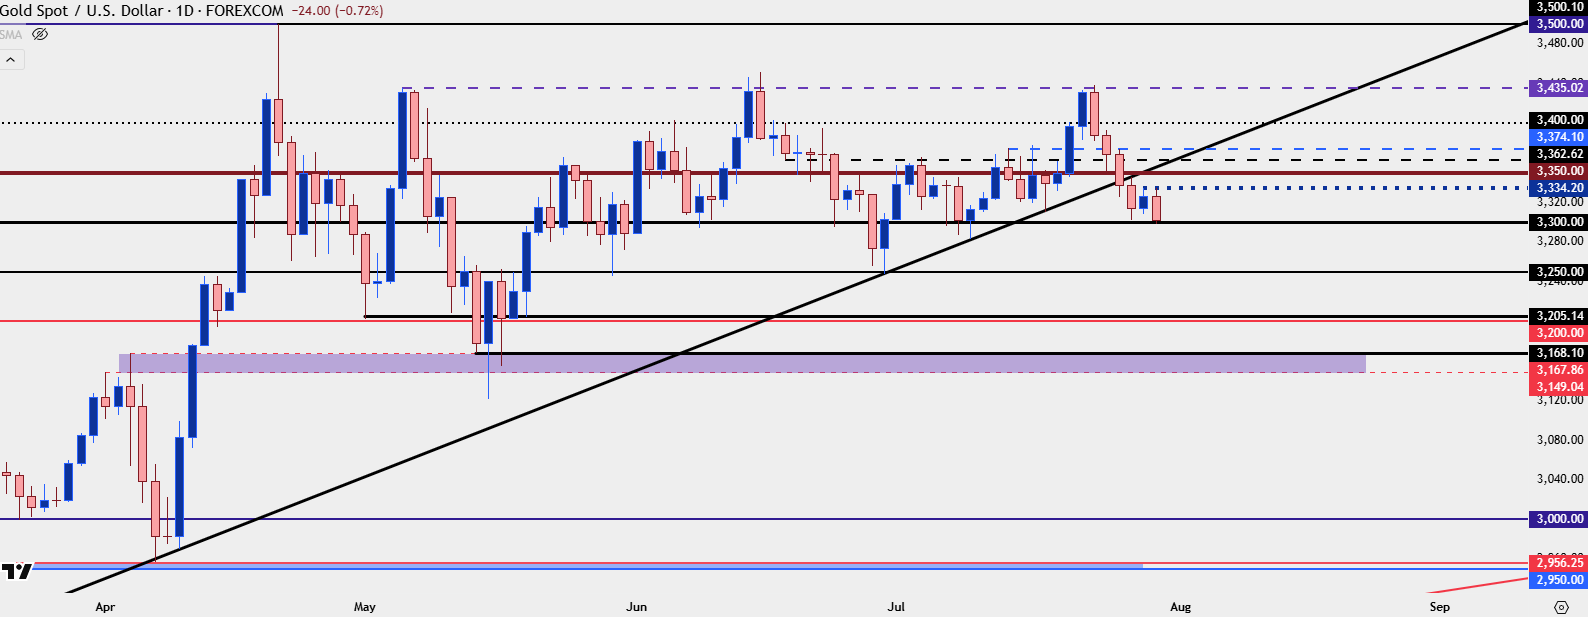
Chart prepared by James Stanley; data derived from Tradingview
— written by James Stanley, Senior Strategist