Pre-FOMC USD Price Action Setups: EUR/USD, USD/CAD, USD/JPY, GBP/USD
July 29, 2025 21:26USD Talking Points:
- The next few days are big for the U.S. Dollar as the FOMC rate decision on Wednesday is followed by the Fed’s preferred inflation gauge of Core PCE on Thursday and then we have Non-farm Payrolls on Friday.
- The USD has rallied since last Thursday around the ECB rate decision to set a fresh monthly high earlier today. Fibonacci resistance is holding bulls at bay for now, at the 98.98 level which is related to the 102 level that held the highs back in May.
- This is an archived webinar and you’re welcome to join the next one live. Click here to register.
The USD rally has continued with the currency setting a fresh monthly high this morning. Buyers are currently grinding away at the 98.98 Fibonacci level, which is the 61.8% mark of the 2021-2022 major move. Notably, the 50% marker of that same move set the highs in mid-May at the 102.00 handle and that has some relationship to a prior FOMC rate decision, which brings us to the next point.
Tomorrow’s FOMC meeting is important as the market continues to expect two 25 bp rate cuts by the end of the year and after tomorrow’s meeting, there’s just three Fed rate announcements left for this year. So if the Fed is going to cut at two of the remaining three meetings in 2025, logically, they’d probably need to start laying the groundwork rather soon.
To date, most members of the Fed sound cautious around rate cuts, as last year’s softening led to a flare of inflation earlier in the year. There’s also the matter of tariffs to consider, with many Fed members expecting tariffs to hit supply which could then impact prices. At the last Fed meeting in June the USD broke out after, but it was the following Monday when one of the more dovish Fed members said that she would be open to a July rate cut and the USD weakness came rushing back. That allowed for a fresh three-year low on the first day of Q3, but since then, there’s been a shift. This morning’s higher-high couples with last week’s higher-low to illustrate bullish potential in the USD, and that puts a lot of emphasis on the calendar for the rest of this week.
At this point the US economy doesn’t appear to be in dire need for rate softening. Inflation data is coming out the day after and Core PCE is expected at 2.7%, which is well above the Fed’s 2% target. The day after we get NFP, and the unemployment rate is expected at 4.2% which, again, doesn’t highlight urgent need for accommodation from the Fed. Collectively, that will all help to shape the argument as to whether USD bulls can show greater run in Q3 after an aggressive sell-off in the first-half of the year.
U.S. Dollar Daily Chart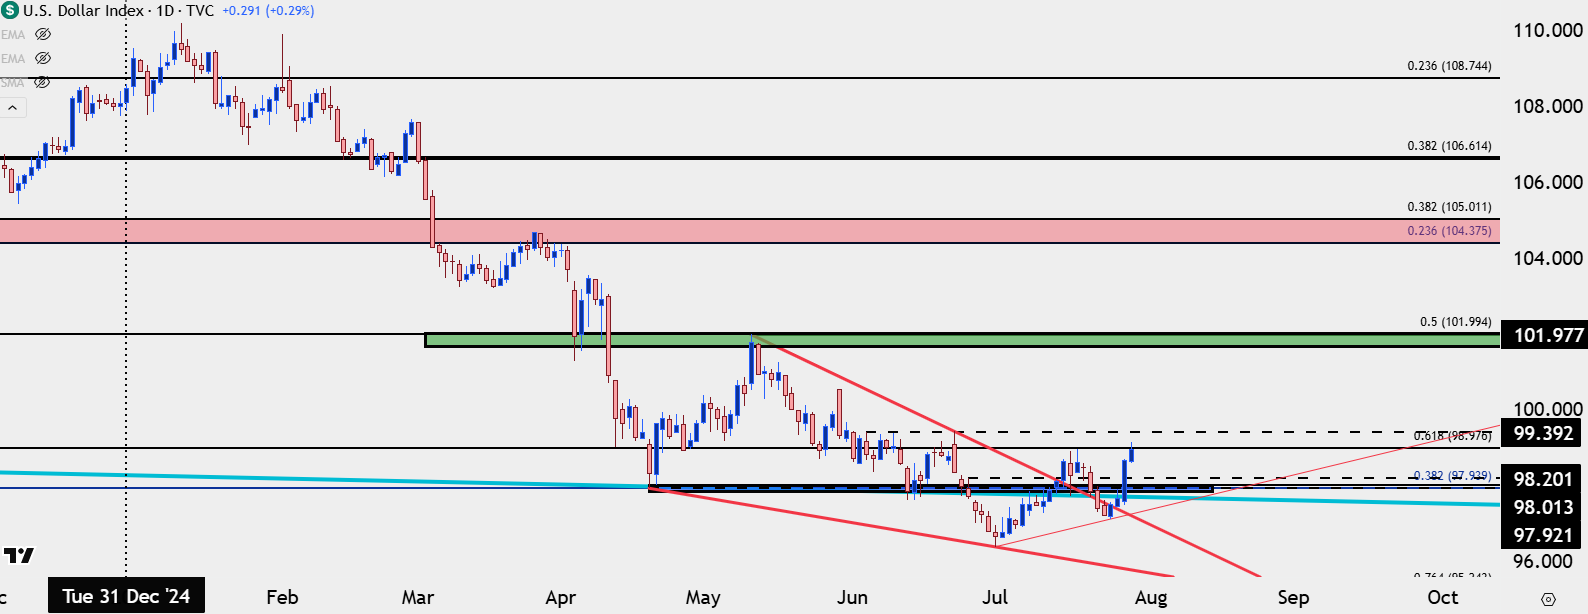
Chart prepared by James Stanley; data derived from Tradingview
EUR/USD
For USD-strength I still favor EUR/USD. I looked at a series of resistance levels in last week’s webinar and the first of those came into play around the ECB meeting. Since then, bears have been making more and more of a mark, with last Friday showing a hold of resistance at the Fibonacci level of 1.1748.
For next support the 1.1500 level is big, as this is a psychological level that can take some effort for bears to take-out, like how it took bulls a couple of different attempts over two months (late April to late June) before that resistance could finally play as support. This doesn’t eliminate bearish potential, but it does highlight that chasing the move at this point could be dangerous given the short-term oversold readings. Instead, this places emphasis on lower-high resistance potential at levels like 1.1560, which is already in-play, or 1.1632 or 1.1663, after which 1.1686 could even be of interest as this would be below last Friday’s high at the 78.6% Fibonacci retracement.
EUR/USD Daily Chart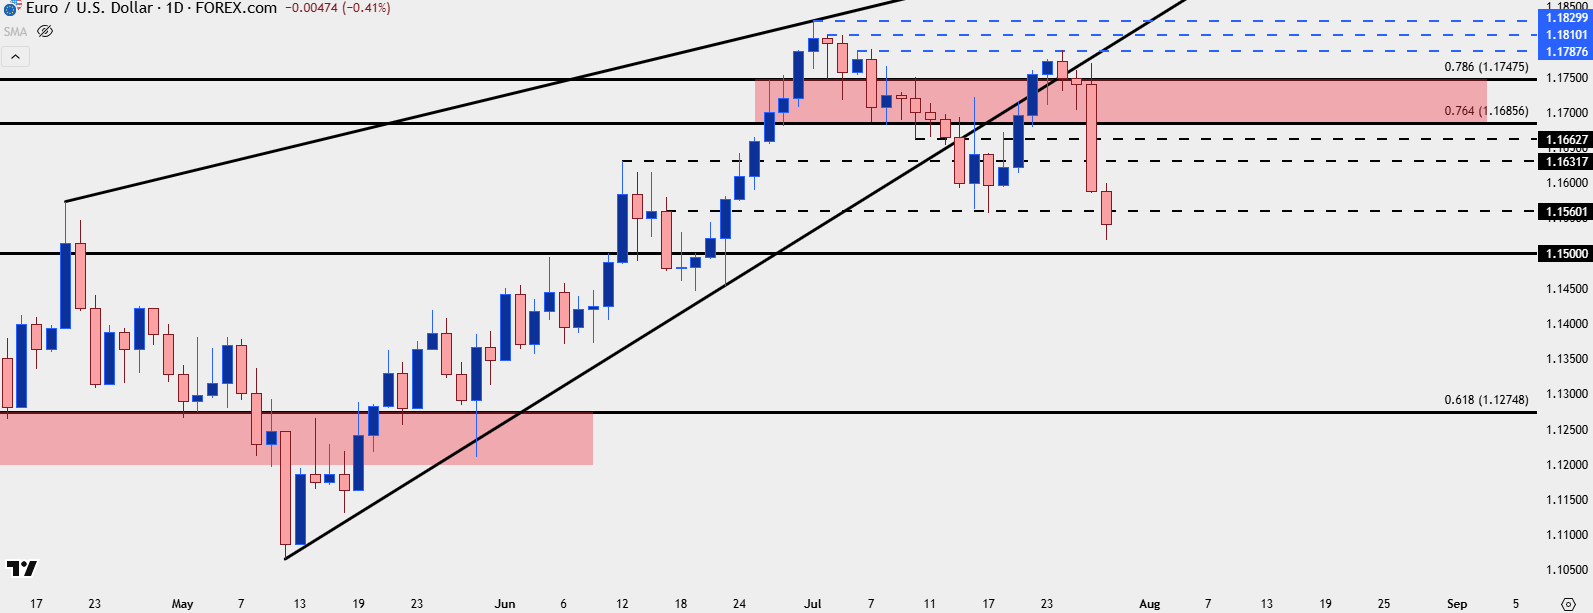
Chart prepared by James Stanley; data derived from Tradingview
USD/JPY
USD/JPY is of particular interest this week for multiple reasons. One of the big ones is the macro overtones from the pair that remain pertinent to the U.S. Dollar. A larger wave of USD-weakness could threaten to up-end the carry trade, which could then take on repercussion elsewhere, such as stocks. But there’s also the fact that JPY-weakness has been taking on more and more importance over the past three months as USD/JPY has consistently held higher-lows even as the USD was driving down to fresh three-year lows on the first day of Q3 trade.
At this point there’s a massive spot of resistance sitting overhead and bulls have failed to test through it on multiple occasions. I looked into this in yesterday’s article and video, but the 148.00 zone has now held three different inflections going back to early-Q2 trade. But – each push has grinded a little bit higher, and the corresponding lows from each has also held at higher-lows.
To get up to that next resistance at the 150.00 handle the pair will probably need a catalyst, and the Bank of Japan meeting taking place later in the day after the FOMC meeting could set that stage. The 200-day moving average plots around 149.60 and the 150.00 level is a price that’s had importance in the pair since 2022, when the BoJ intervened to defend the level.

USD/JPY Daily Price Chart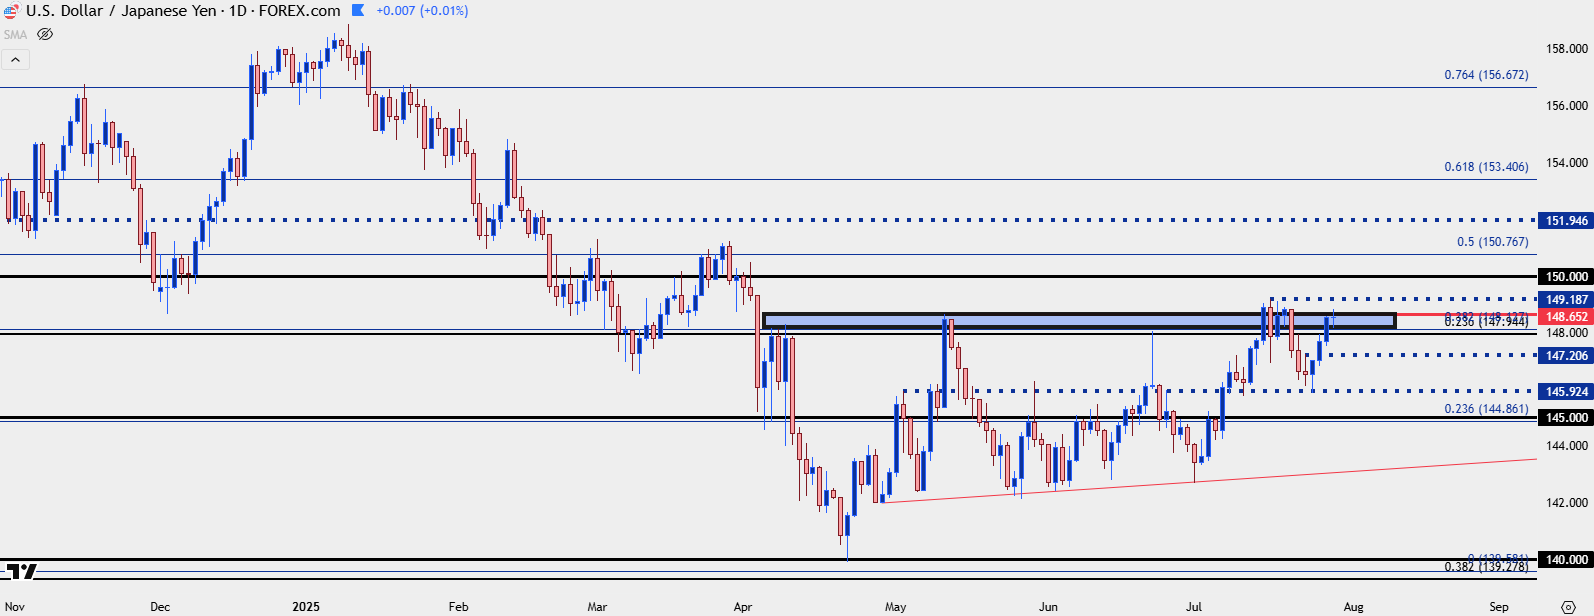
Chart prepared by James Stanley; data derived from Tradingview
USD/CAD
I warned of a larger bullish push in USD/CAD in last week’s webinar and the trendline came into play to hold the lows a day later. Since then, buyers have been making a push and today sees bulls testing above the 1.3750 level yet again.
I do remain to think that bigger picture bearish potential could come back at some point, but given the lack of seller aggression around 1.3500 it looks as though the pair remains to be heavily one-sided. So I would like to see shorts squeezed out a bit more before I get optimistic on bearish continuation in the pair. That said, there’s a couple of big spots of resistance nearing, with the 1.3798 level coming close and then the zone around 1.3900 overhead. Above that, the 1.4000 level remains a big deal and if we do see USD bulls stage a larger reversal, the 1.4151-1.4178 zone could even be of interest as a longer-term lower-high.
USD/CAD Daily Chart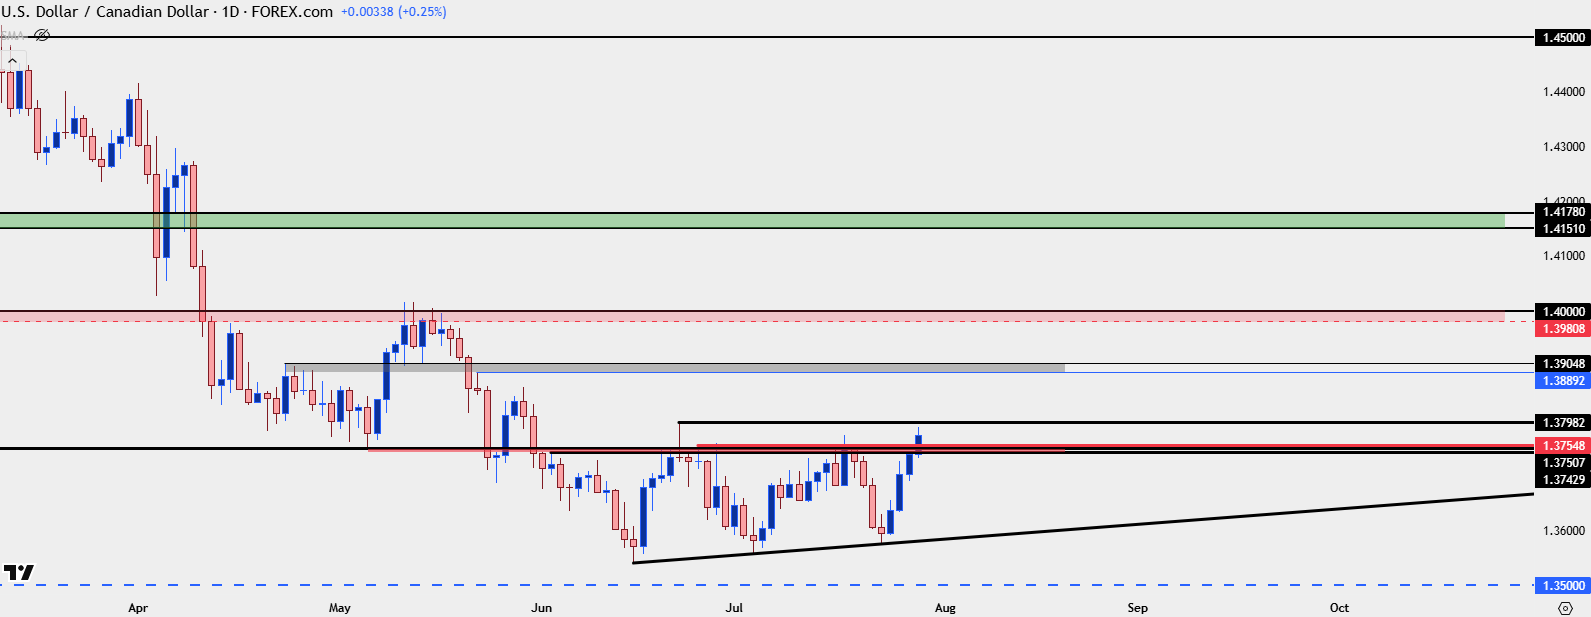
Chart prepared by James Stanley; data derived from Tradingview
GBP/USD
A couple of weeks ago following the CPI release we had a pretty dramatic ordeal around the USD. In that webinar, I warned that I thought Trump would threaten to fire Powell in response to the USD-strength that had so far built in Q3. That took place less than 24 hours later, and that helped to bring a sell-off in the USD that lasted into the following week.
At the time that I made that comment USD-strength was showing visibly on a short-term basis and it was difficult to find markets for USD-weakness scenarios. I picked on GBP/USD for that as I had been tracking the pair for Dollar weakness for some time already.
The pair was oversold on the four-hour chart and testing a really big spot of support. As the USD-weakness appeared a day later, GBP/USD spiked up to a higher-high, which then led to a higher-low, and shortly after there was a bullish reversal to work with.
But as USD-strength has come roaring back so have sellers in Cable. And, again, RSI on the four-hour chart has put in a visit to oversold territory. In the webinar, I highlighted the level that I wanted to see taken-out to give an illustration of a short-term higher-high. This would remain as one of the more attractive setups for USD-weakness, in my opinion, until something changes.
GBP/USD Four-Hour Chart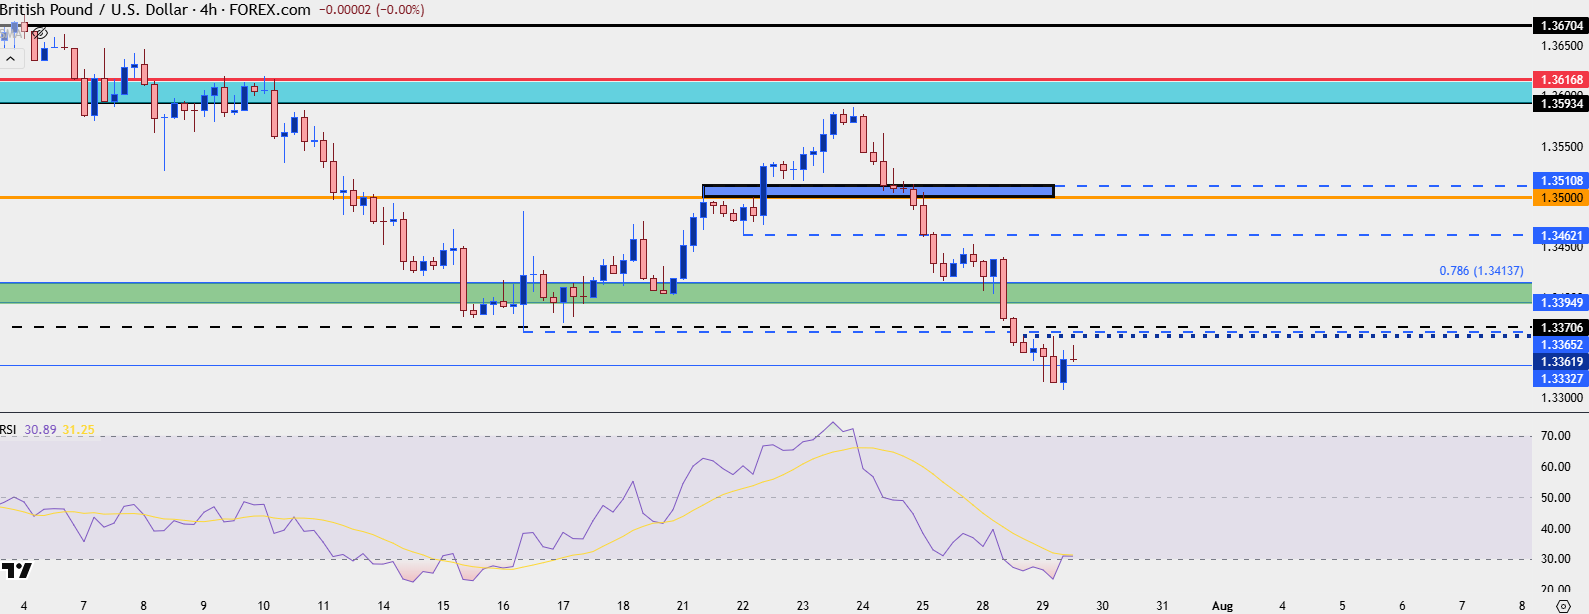
Chart prepared by James Stanley; data derived from Tradingview
— written by James Stanley, Senior Strategist