DXY and Gold Face Key Resistance Levels as Market Risks Loom
July 28, 2025 14:20Key Events to Watch This Week:
- Leading US Economic Indicators: FOMC (Wednesday), US Core PCE (Thursday), US NFP (Friday), and ISM PMI (Friday)
- Central Bank Rate Decisions and Their impact on Market Sentiment: Bank of Canada (Wednesday), Federal Reserve (Wednesday), and Bank of Japan (Thursday)
- Tech Earnings and Market Sentiment: Microsoft and Meta (Wednesday); Apple and Amazon (Thursday)
This time last year, between the end of July and the beginning of August, a major market-moving event occurred, sending shockwaves across global markets. The Bank of Japan ended its negative interest rate policy for the first time in 17 years, creating a significant carry trade effect.
This year, markets are buoyed by trade deal optimism and anticipation around central bank decisions as we head into what could be a critical, trend-defining week. The packed economic calendar includes big tech earnings, multiple central bank meetings, and key inflation, employment, and growth data. Meanwhile, charts are hovering near pivotal levels and technical pattern boundaries. The US Dollar is holding above a 17-year trendline, and Gold is flirting with the potential for another record-breaking breakout.
The US Dollar Index is maintaining its rebound off a trendline that has been respected since 2008, while Gold is consolidating within a triangle formation—or possibly an inverted head and shoulders pattern—between its record high of 3500 and support at 3100. Monthly momentum is overstretched at levels last seen in 2020 and 2008. What are the scenarios for this week?
Technical Analysis: Quantifying Uncertainties
DXY Outlook: Monthly Time Frame – Log Scale
Source: Tradingview
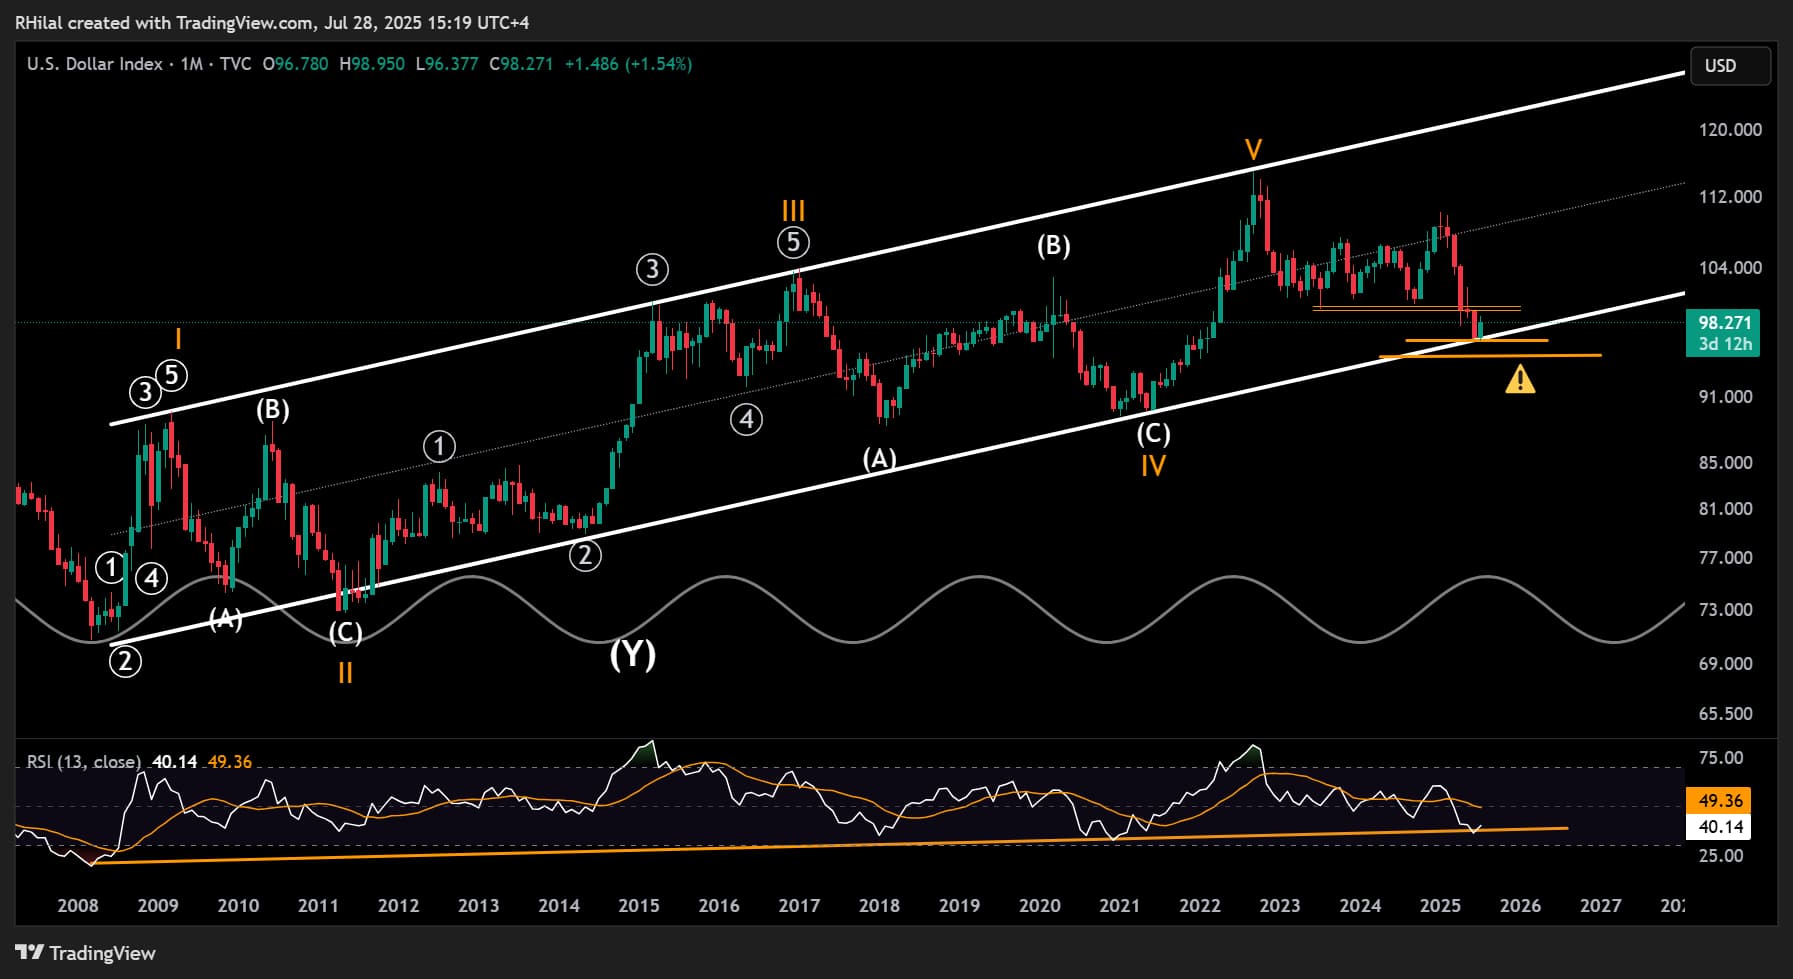
The US Dollar Index (DXY) has held its rebound off historical support zones on both the price chart and the RSI indicator throughout July. The monthly RSI is bouncing off a support line extending between the troughs of 2008 and 2020. Meanwhile, price action is rebounding from a support trendline that connects the lows of 2008, 2014, and 2021, within the 96–94 zone.
Bearish Scenario: A solid close below this support zone may confirm a long-term bearish signal, potentially pushing the index toward the 94 and 90 levels.
Bullish Scenario: A confident move above 100 and 103 could signal a reversal in the currency market, potentially leading the DXY back toward the mid-range of the long-standing channel between 105 and 107, originating from the 2008 lows.
Gold Outlook: 3-Day Time Frame – Log Scale
Source: Tradingview
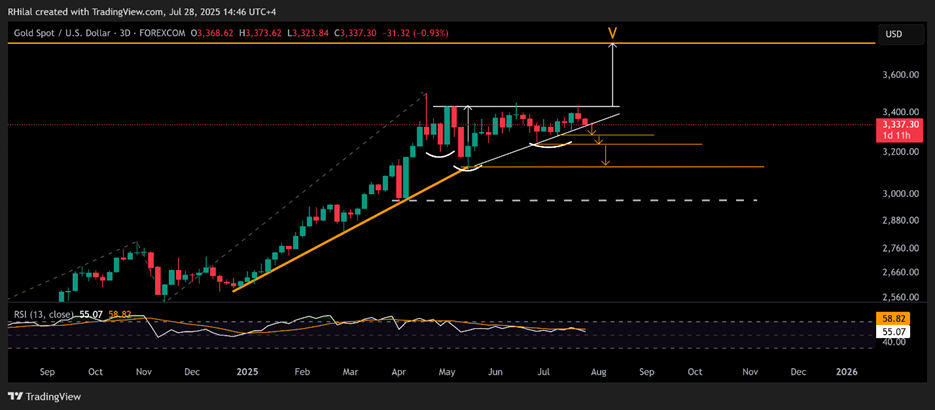
After reaching its record high of 3500 in April 2025, Gold entered a contracting consolidation phase lasting nearly four months, bounded between the 3500-resistance and 3100-support. This structure sets the stage for a breakout, with price action tracing five waves—raising the probability of another leg higher.
- Bullish Scenario: A close above the 3450 level could open the door to 3780 and even 4000, aligning with the broader monthly cup-and-handle formation target.
- Bearish Scenario: A close below 3300 could expose the market to downside risks, with potential retracements to 3280, 3250, 3200, and 3130.
Written by Razan Hilal, CMT
Follow on X: @Rh_waves