Fed, DXY, EUR/USD, USD/CAD, Gold, Bitcoin Weekly Technical Outlook
July 28, 2025 18:34Weekly Technical Trade Levels on USD Majors, Commodities & Stocks
- Technical trade setups we are tracking into the weekly open
- Next Weekly Strategy Webinar: Monday, August 4 at 8:30am EST
- Review the latest Video Updates or Stream Live to my YouTube playlist.
In this webinar we take an in-depth look at the technical trade levels for the US Dollar (DXY), Euro (EUR/USD), British Pound (GBP/USD), Australian Dollar (AUD/USD), Canadian Dollar (USD/CAD), Japanese Yen (USD/JPY), Swiss Franc (USD/CHF), Gold (XAU/USD), Crude Oil (WTI), and Equity Indices. These are the levels that matter on the technical charts into the weekly open.
US Dollar Price Chart – USD Weekly (DXY)
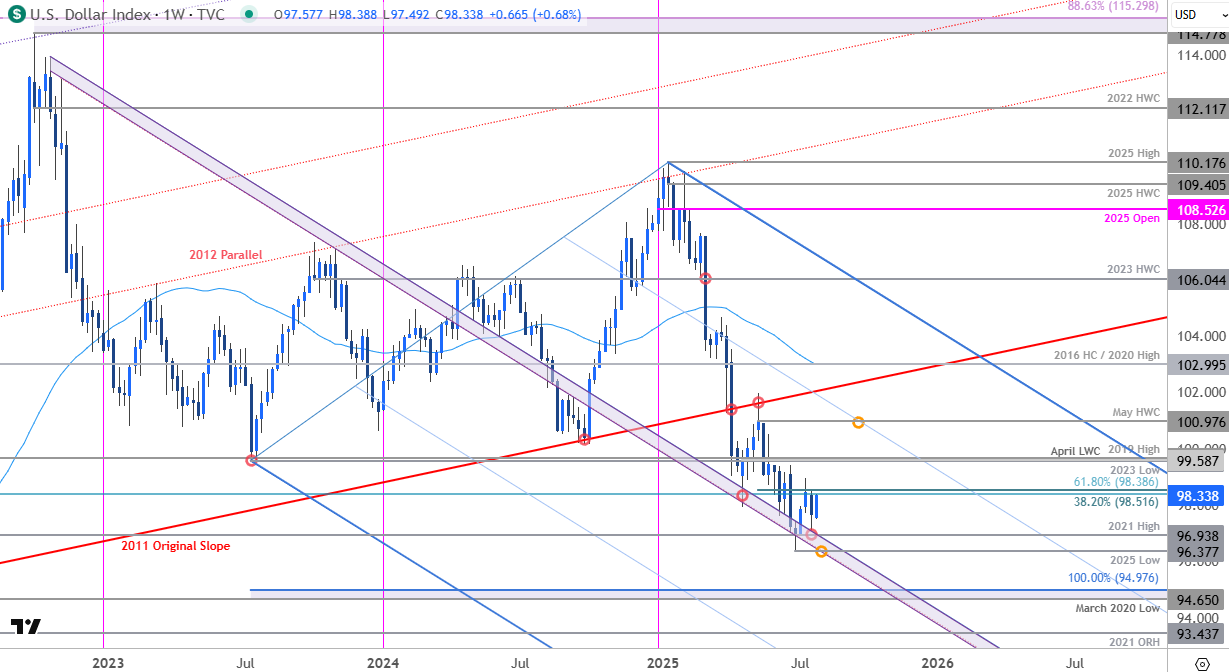
Chart Prepared by Michael Boutros, Sr. Technical Strategist; DXY on TradingView
The US Dollar is trading just above multi-year downtrend support heading into the start of a jam-packed week of event risk (FOMC, PCE, NFP). The focus heading into the August open is on a breakout of the 96.94-98.52 range for guidance with the broader short-bias still vulnerable while above the yearly low / median-line at 96.38. Subsequent resistance seen at 99.58/67 with broader bearish invalidation steady at 100.98. Review my latest US Dollar Short-term Outlook for a closer look at the near-term DXY technical trade levels.
Euro Price Chart – EUR/USD Daily
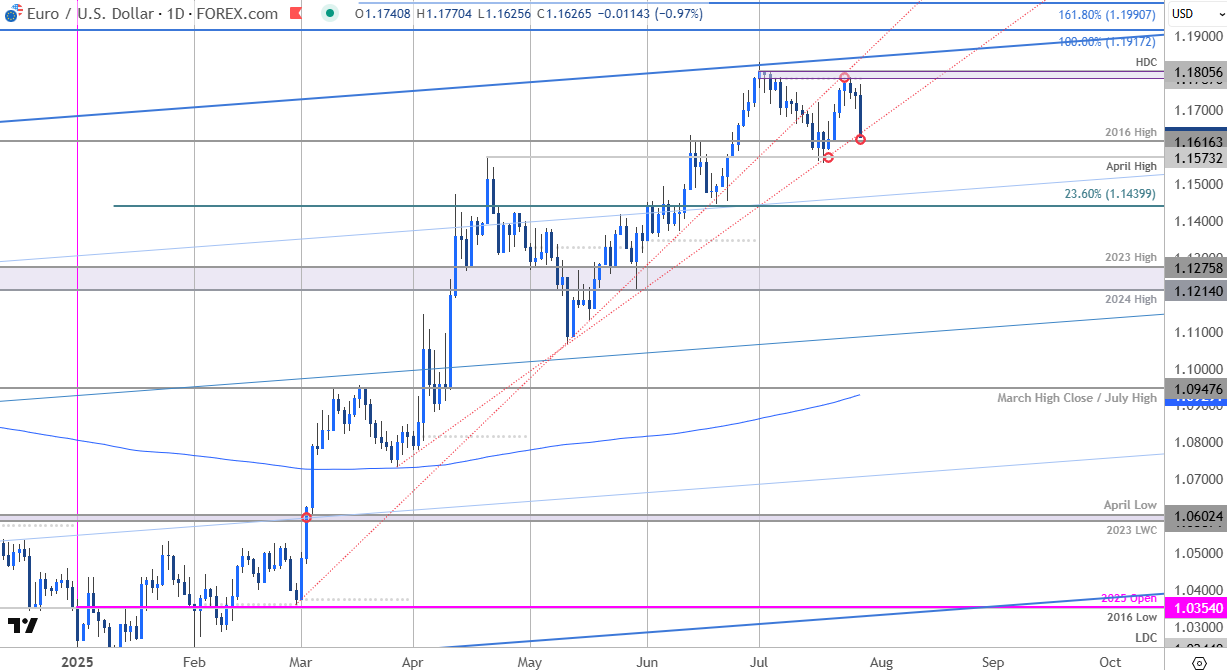
Chart Prepared by Michael Boutros, Sr. Technical Strategist; EUR/USD on TradingView
Euro defended resistance at the monthly opening-range high / July open at 1.1787-1.1805 last week with price plunging back into support today at the late-February trendline / 2016 high at 1.1616. Medium-term bullish invalidation rests with the April high at 1.1573 and a close below this level would suggest a more significant high is in place / a larger correction is underway. Stay nimble here into the monthly-cross and watch the weekly closes for guidance. Review my latest EUR/USD Technical Forecast for a closer look at the longer-term Euro trade levels.

Bitcoin Price Chart – BTC/USD Weekly
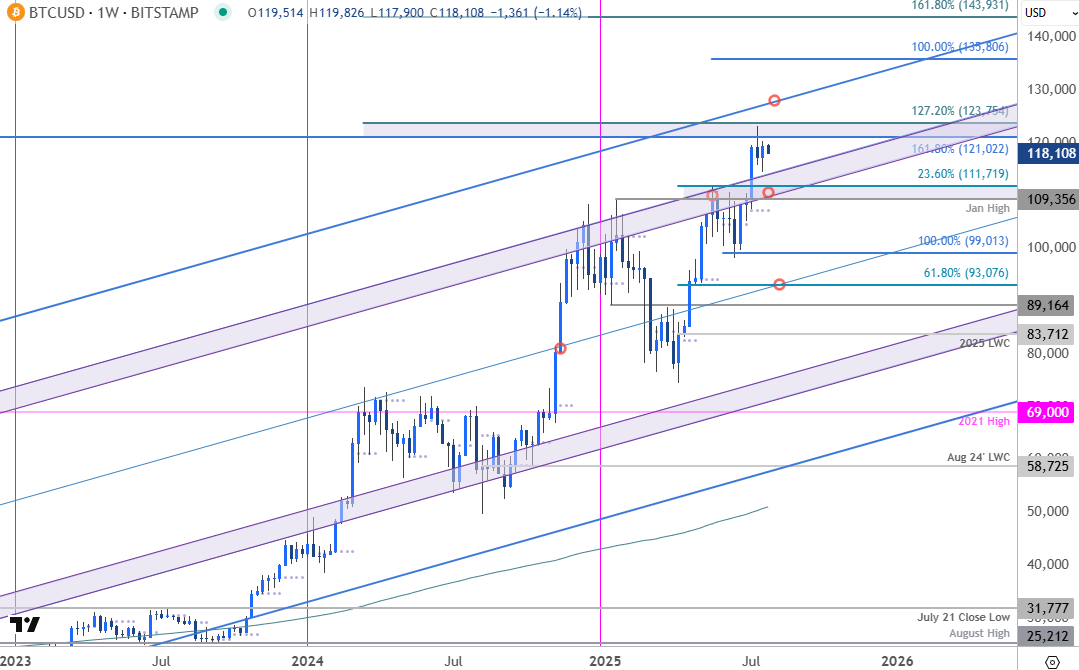
Chart Prepared by Michael Boutros, Sr. Technical Strategist; Bitcoin on TradingView
Earlier this month we highlighted the risk for topside exhaustion as a breakout of the yearly-opening-range in Bitcoin extended into confluent resistance at 121,022-123,7541– a region defined by the 1.618% extension of the broader 2019 advance and the 127.2% extension of the 2022 rally. BTC/USD has held below this technical zone for the past three-weeks with weekly momentum just below the overbought threshold. Near-term downside risk persists, but the broader outlook remains constructive while price holds above the January high and the 23.6% retracement of the yearly range at 109,356–111,719.
A breach / close above this pivot zone is needed to fuel a test of the upper parallel, currently near ~127,100. Subsequent resistance objectives eyed at the 100% extension of the April rally at 135,806 and the 1.618% extension at 143,931.

Economic Calendar – Key USD Data Releases
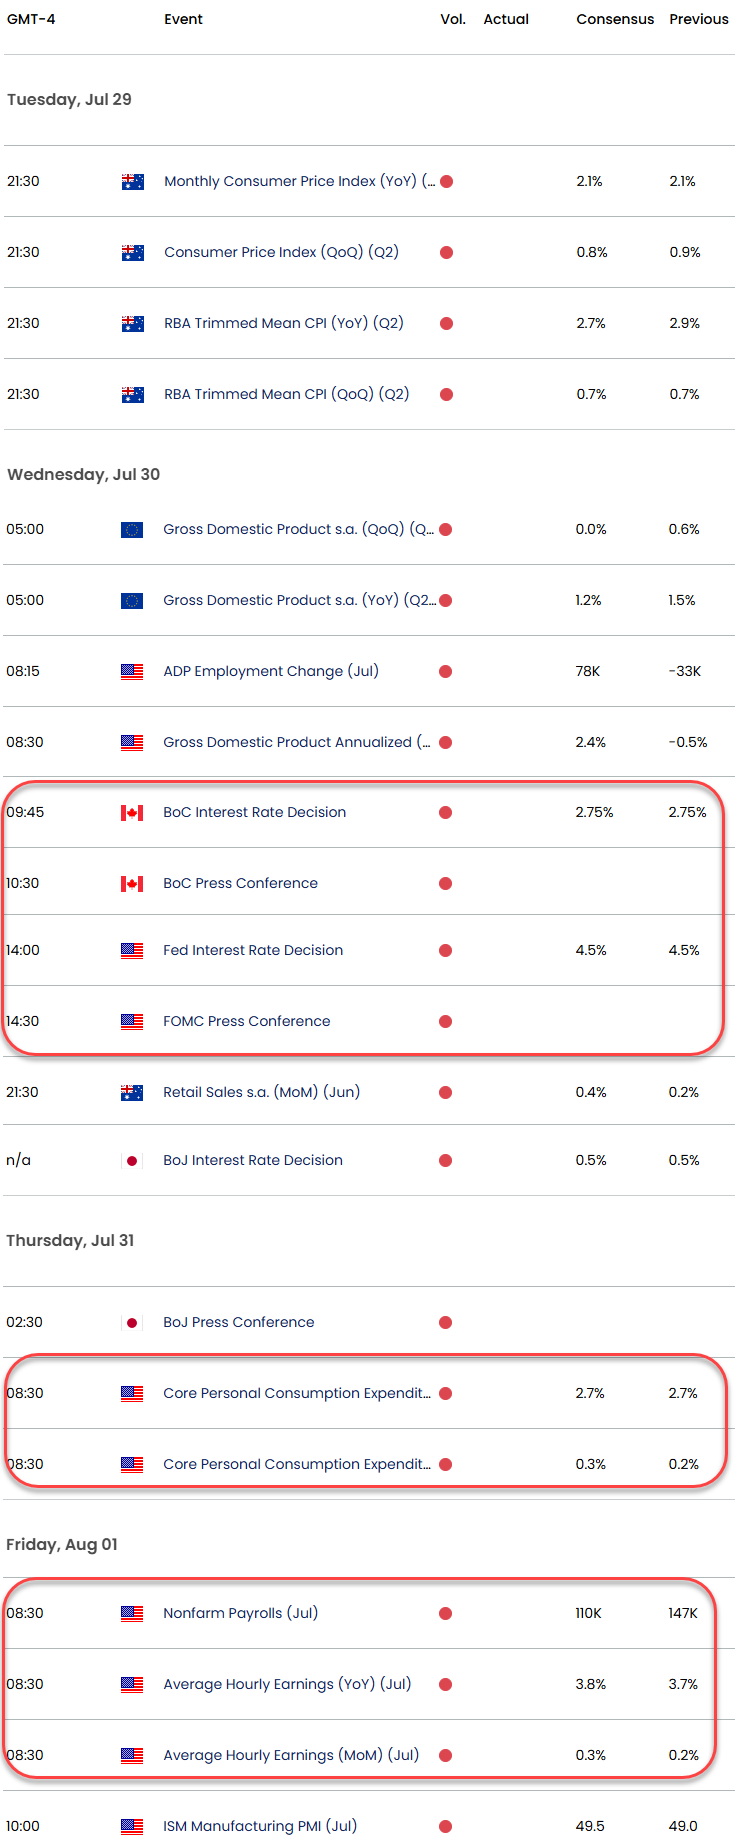
Economic Calendar – latest economic developments and upcoming event risk.
— Written by Michael Boutros, Sr Technical Strategist
Follow Michael on X @MBForex