Gold Price Forecast: XAU/USD Trendline Bounce Deeper into Digestion
July 12, 2025 21:00Gold Talking Points:
- Both Silver and Bitcoin broke out to fresh highs this week and gold remains below the $3500/oz level from April.
- While gold has been in a strong breakout for much of the past year and five months it’s peculiar to see the metal lagging behind other anti-fiat vehicles such as Silver or Bitcoin.
- I look into gold during each weekly webinar, and you’re welcome to join the next. Click here to register.

Gold rallied by more than 75% from the low last February up to the high in April. But, since that April test at $3500/oz, gold bulls have been unable to establish fresh highs. This isn’t to say that price action has been decisively bearish, because it hasn’t. There’s been large and strong reactions to support, such as we saw in the middle of last quarter, when buyers were re-claiming support at prior resistance, from around the $3149-3167 zone. And then in late-May and again in late-June at the $3250 level.
The complication has been more about bringing in fresh bulls while at tests of resistance or near highs, and that’s the kind of thing that can, eventually, lead to a larger pullback. It hasn’t happened yet and as shared in the most recent webinar, I continue to bias to the bullish side on gold; and until some evidence shows that buyers aren’t defending support, I’m likely going to stick to that stance just given how strong the trend has been.
For last week, we had another item of support show as a trendline came into play on Wednesday and led to a push back up to short-term resistance of $3362. That was a swing-low from mid-June, and that price has now held a couple of different resistance inflections. When combined with the higher-low from last week, that makes for an ascending triangle formation which is often tracked with aim of bullish continuation.
Gold Daily Price Chart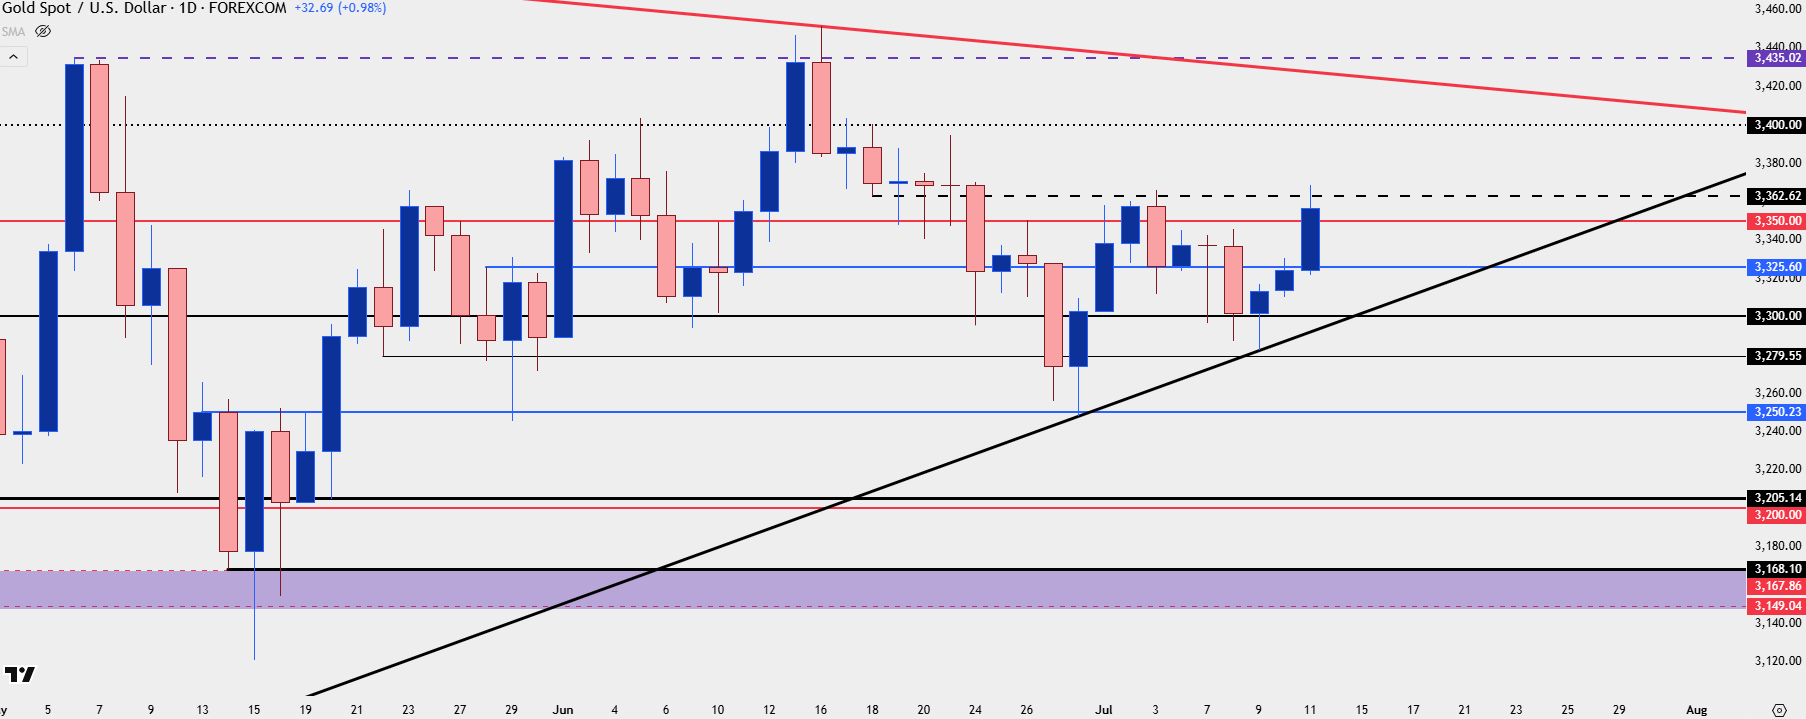
Chart prepared by James Stanley; data derived from Tradingview
Gold Strategy
At this point the near-term trend can be construed as bullish in gold, but the complication has been upon tests of highs or resistance. This doesn’t necessarily preclude a breakout – but it does highlight caution towards chasing one. And, instead, puts the focus on shorter-term support tests on pullbacks to keep the door open for a larger bullish move.
On the below chart I’m looking at two trendlines highlighting both the lower-highs and higher-lows that have shown in gold over the past few months. The 3400 test is the next major level overhead, and then it’s the 3435 level which has so far held two rigid reactions of resistance. If bulls can drive above that, then the door opens for a re-test at $3500/oz. Given the moves seen in both Bitcoin and Silver this week, it has to be held as a possibility that gold could follow suit with another move of bullish continuation.
But – if we do see failure, there’s still an open door for a support test around the $3200 level, which was the price that was setting short-term support around the time of the $3500 test back in April. Notably, there was penetration below that price in May as the $3149-3167 test appeared. But – a pullback there opens the door for bulls to come in at a lower price and a prior support level and, if they don’t, the possibility of a larger pullback must be considered.
Gold Weekly Price Chart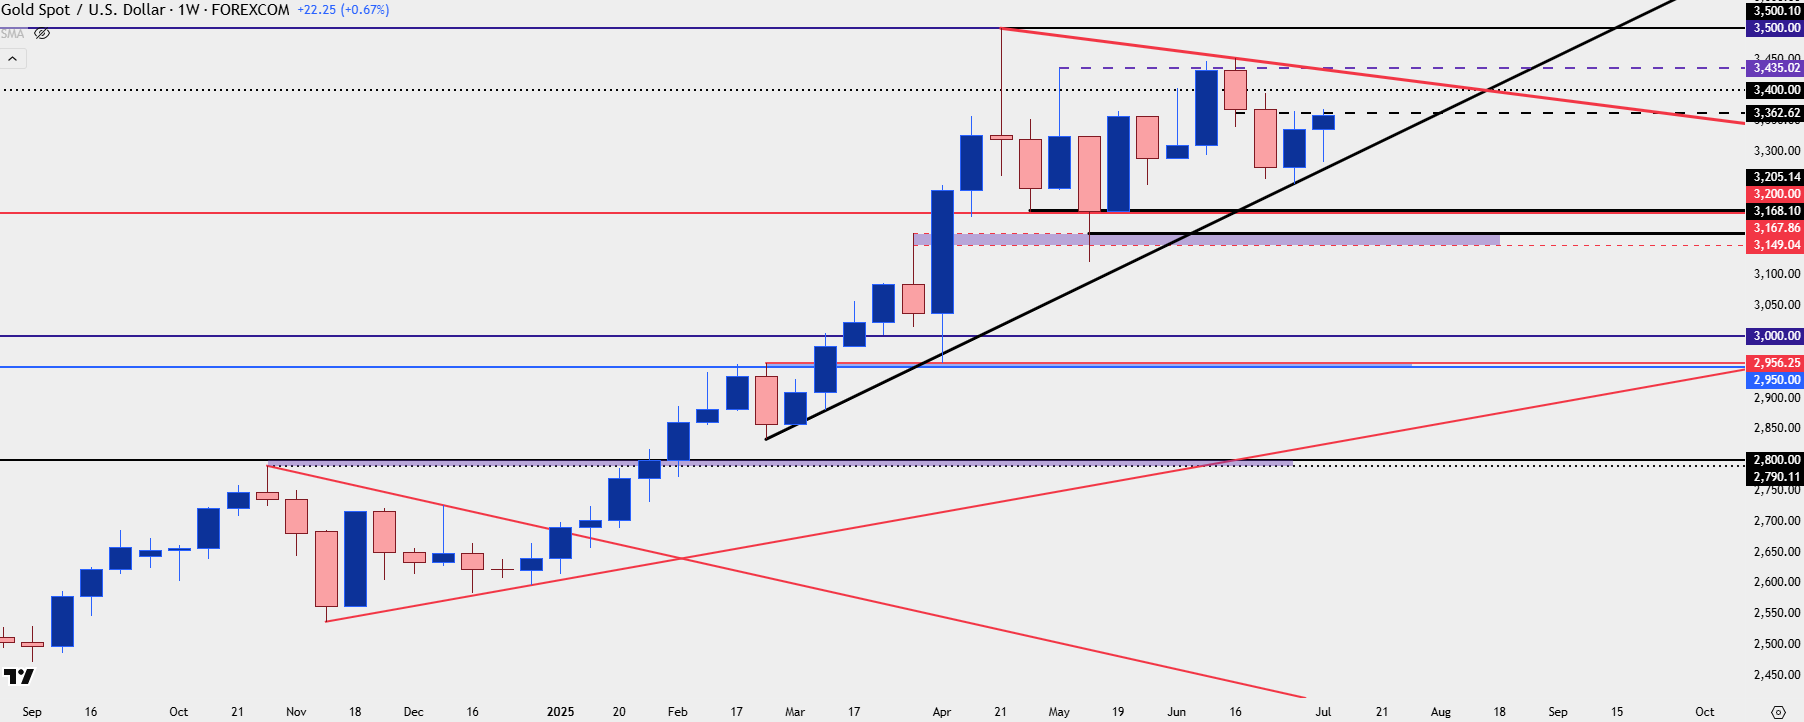
Chart prepared by James Stanley; data derived from Tradingview
— written by James Stanley, Senior Strategist