U.S. Dollar Price Action into CPI: EUR/USD, GBP/USD, USD/CAD, USD/JPY
July 11, 2025 21:50U.S. Dollar Talking Points:
- The U.S. Dollar continues to test resistance and this is the same resistance that was in play on the Tuesday webinar, as taken from prior support.
- Between resistance tests we’ve had a higher-low, illustrating some degree of bullish anticipation. This puts focus on the Tuesday CPI release for next week with headline CPI expected to increase to an annualized 2.6% from a prior read of 2.4%.
- I’ll be looking at each of these markets in the webinar on Tuesday with updated price action after the CPI report. You’re welcome to join, click here to register.
The U.S. Dollar has put together a strong week so far and that statement can be extended into the prior week, ever since the second day of Q3 trade. The currency dropped down for a fresh three-year low on the first day of Q3 and the second-half, but since then, bulls have put together a consistent streak of higher-highs and higher-lows albeit more reaction to support so far than resistance, over the past week.
I looked at this in the Tuesday webinar and the backdrop has continued to develop since, with the same resistance zone remaining in-play to go along with higher-lows. Notably, this is also the same support zone that set the lows back in April and then again in mid-June, before finally being taken-out in late Q2 trade.
U.S. Dollar Four-Hour Price Chart
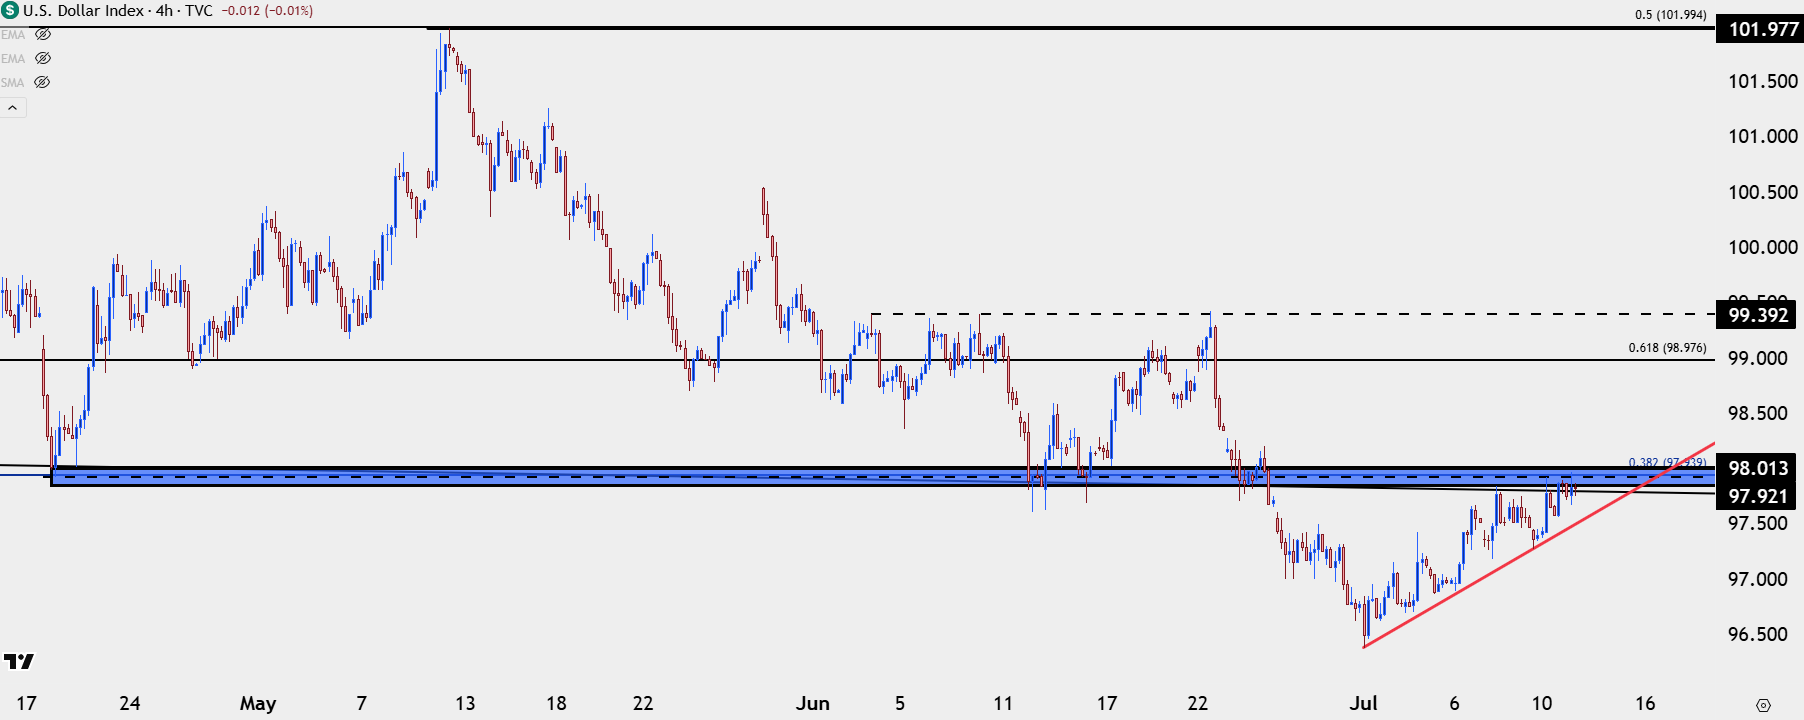
Chart prepared by James Stanley; data derived from Tradingview
Whether this can turn into anything more than a pullback will likely draw back to the CPI release on Tuesday, which is expected to see inflation push up to 2.6% annualized for headline inflation against last month’s 2.4% print. Also of interest is the recent reaction to tariff threats from President Trump, where USD is now appearing to show an element of strength whereas earlier in the year, it was weakness around that similar driver.
Nonetheless, price action has some points to prove if we are going to see a larger pullback and the first big item would be rectifying this resistance at prior support, after which deeper resistance levels show at 98.98 and then 99.39.
U.S. Dollar Daily Chart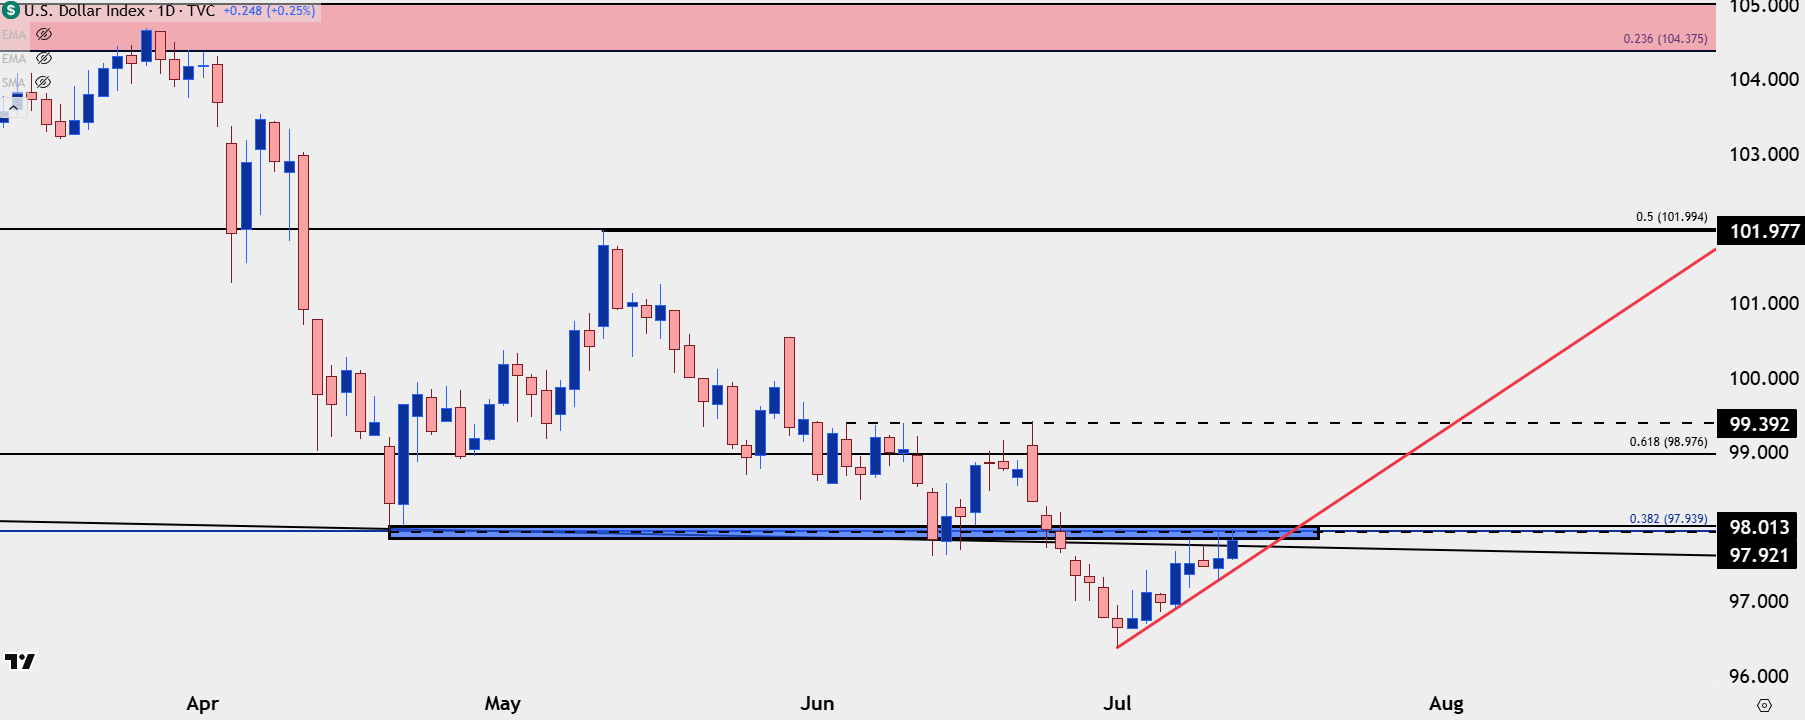
Chart prepared by James Stanley; data derived from Tradingview
EUR/USD Fibonacci Dance
EUR/USD came into Q3 with overbought RSI readings on both the daily and weekly charts, mirroring the oversold readings on DXY on the daily and weekly. While this week has shown a general sense of weakness, bears haven’t exactly had their way as we’ve seen three daily closes, with a possible fourth today, above the 1.1686 Fibonacci level. This is the 76.4% retracement of the 2021-2022 major move and there’s been multiple inflections at key retracement levels from that setup over the past couple of years.
I looked at this in the webinar on Tuesday and then Wednesday and as shared there, was tracking resistance at the 78.6% marker of 1.1748. That level held the highs on Thursday and led to a lower-low. Sellers haven’t yet shown a big push of control yet but if we are going to see a larger turn in the USD for next week, a deeper pullback in EUR/USD remains of interest. For next support, it’s the 1.1632 level and a break of that would open the door for a larger sell-off.

EUR/USD Daily Price Chart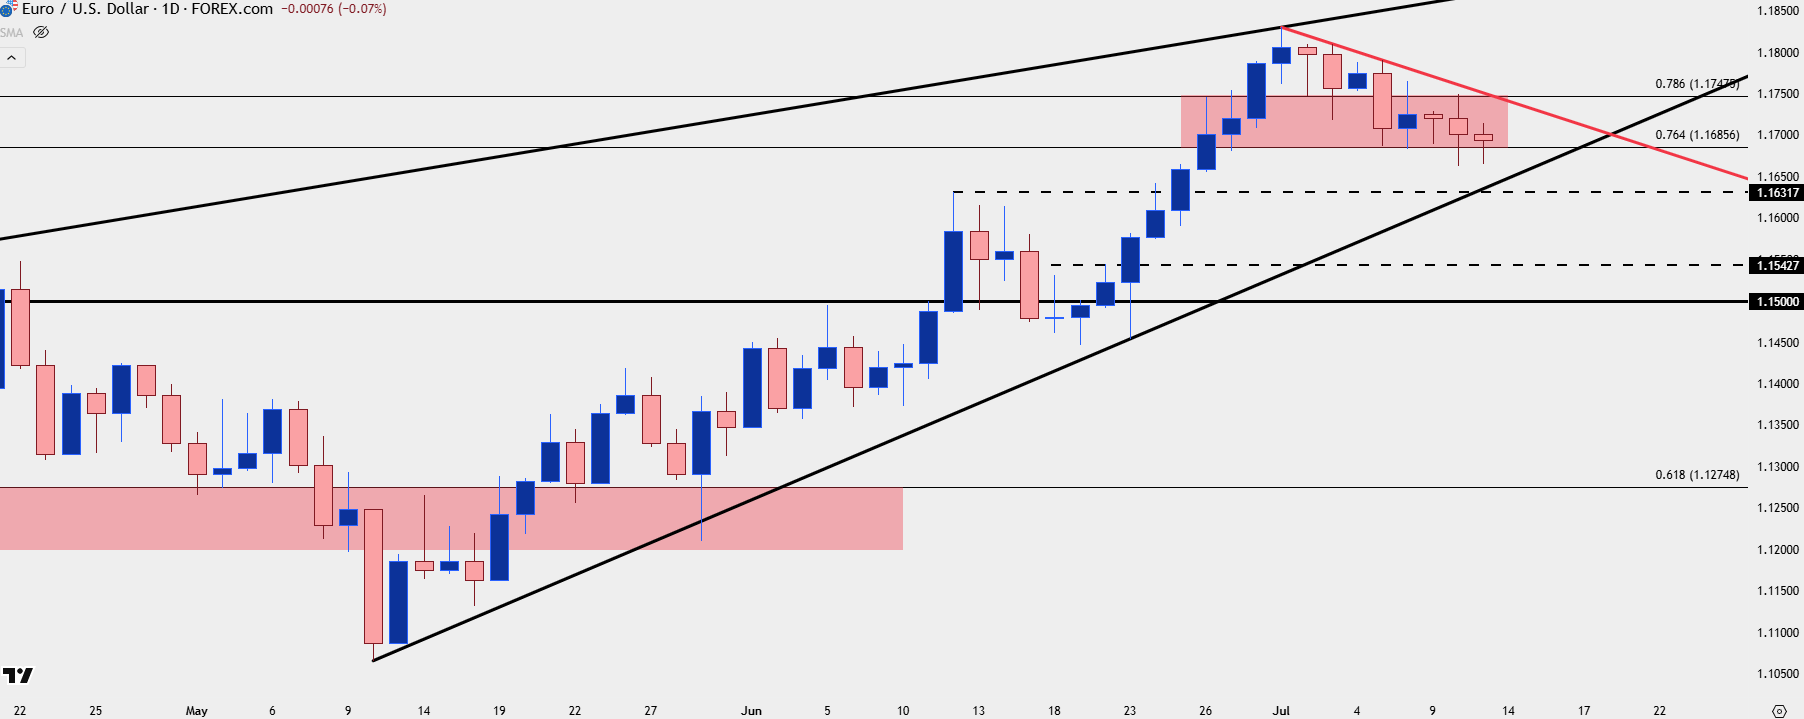
Chart prepared by James Stanley; data derived from Tradingview
GBP/USD 1.3500
In that Tuesday webinar I highlighted the 1.3500 level in GBP/USD, and that price has come into play ahead of the end of the week. If looking for USD-weakness in the near-term, I think that could make for a more attractive backdrop than EUR/USD or perhaps even USD/CAD, at the moment.
GBP/USD Four-Hour Chart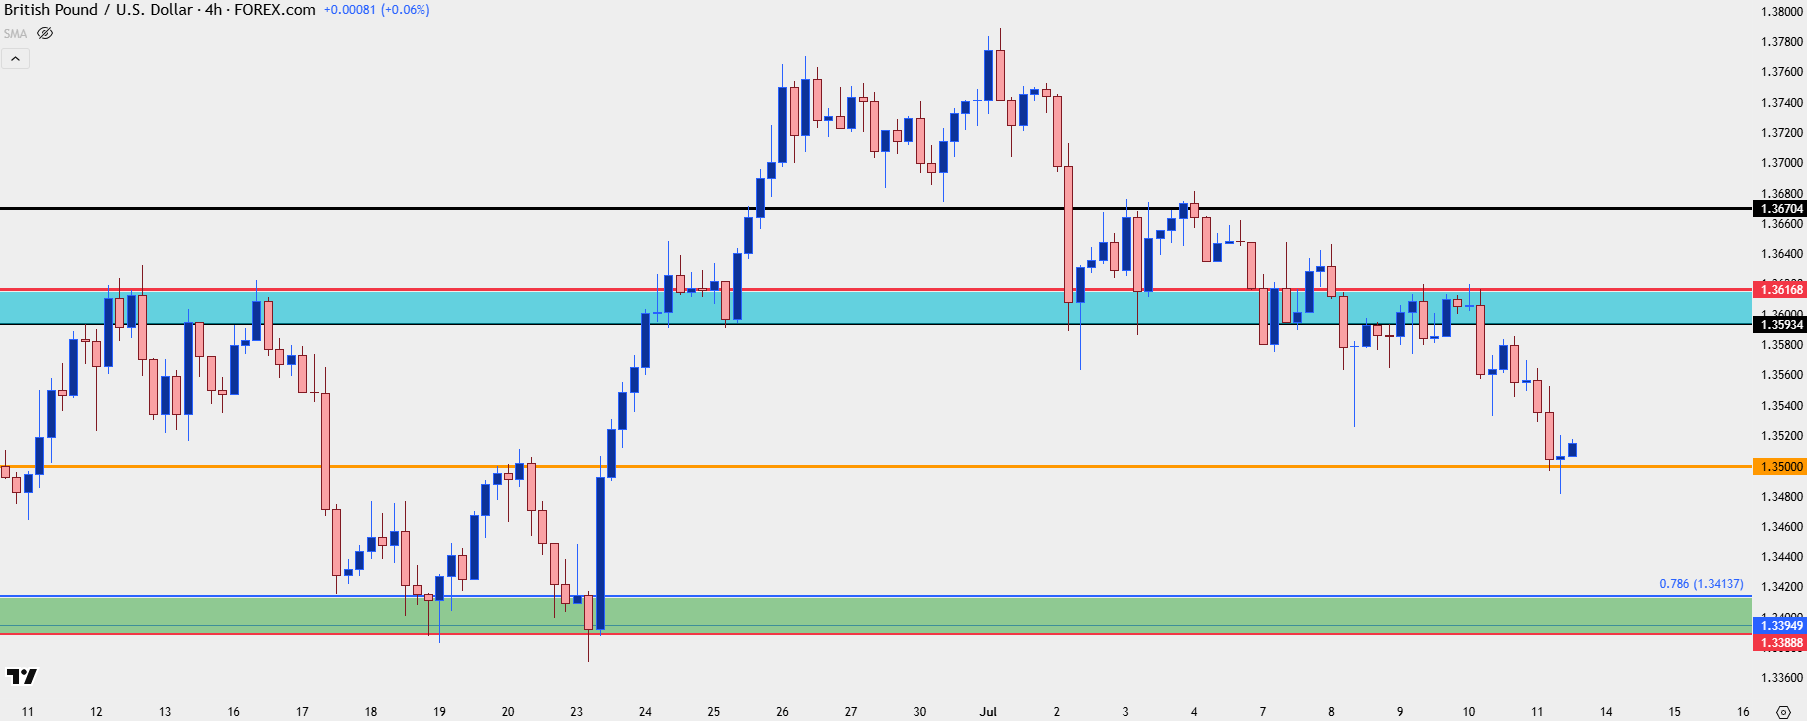
Chart prepared by James Stanley; data derived from Tradingview
USD/CAD The Grind
While DXY set a fresh three-year low on the first day of Q3 trade, USD/CAD did not; instead, the pair held a higher-low without the 1.3500 level coming into play. And notably, while USD has grinding at resistance for much of this week, so has USD/CAD. Collectively, the bearish move looks exhausted here given that failure to push a lower-low combined with this week’s resistance, which showed a higher-high on Friday. I still favor the pair for USD-weakness scenarios but this is a backdrop that may be more fitting for a pullback first before that bearish trend becomes attractive again. Overhead, it’s the 1.2750 level that lurks as next resistance.
USD/CAD Daily Chart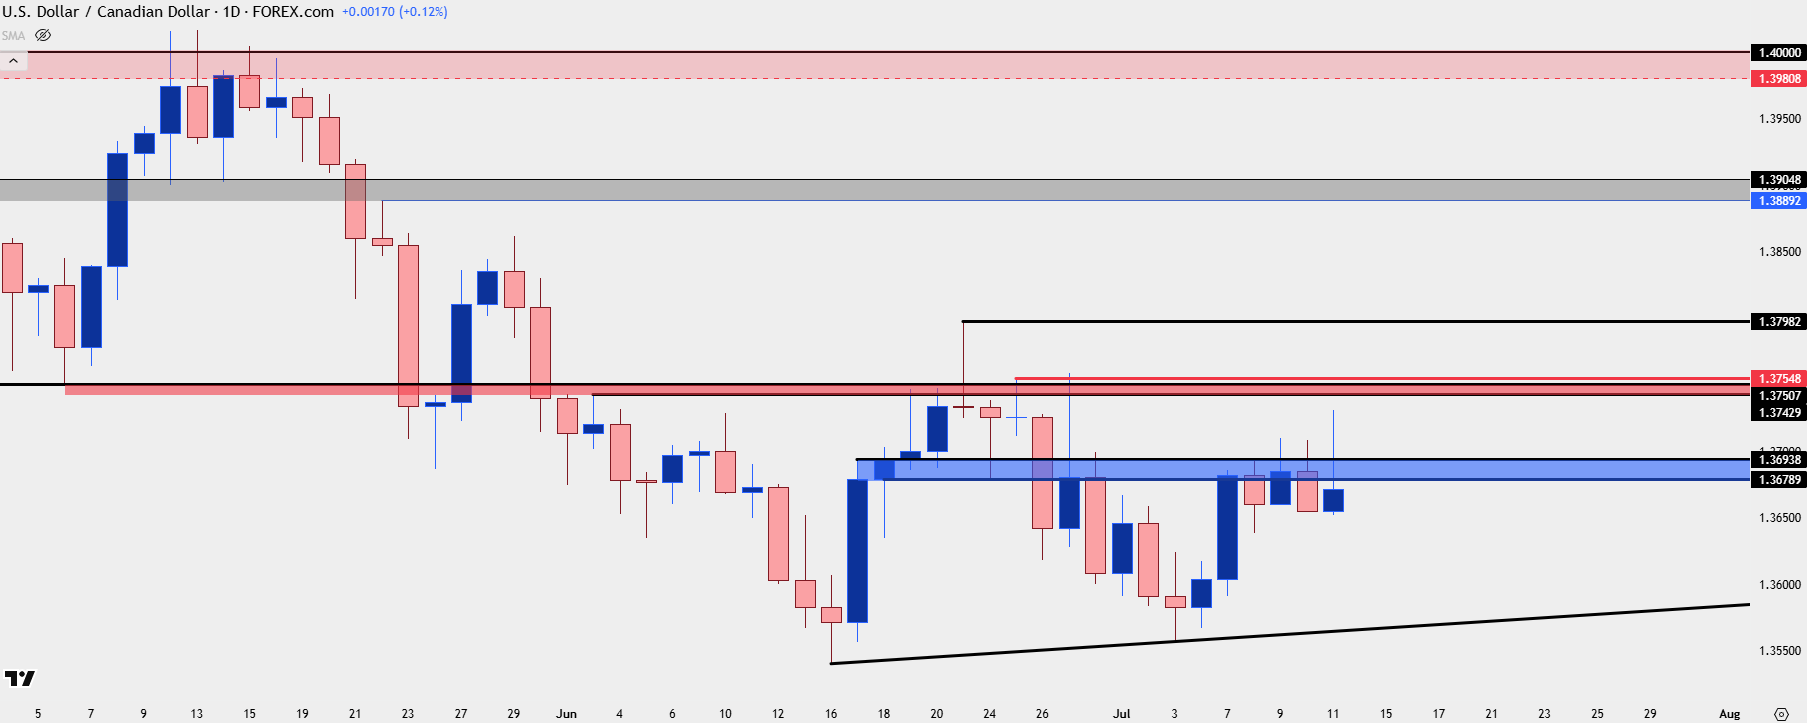
Chart prepared by James Stanley; data derived from Tradingview
USD/JPY
It’s been a strong start to Q3 for USD/JPY, and this is a pair that also showed some deduction on the Q3 open, holding at a higher-low above the 142.50 swing from early-June even as DXY set a fresh three-year-low.
As looked at in the Tuesday webinar bulls have put in a push, with a resistance test at 145.00 followed by higher-low support at prior resistance of 144.25. That was followed by another rally, and then on Thursday, a support test and hold at 145.92. At this point, the 148.00 level is getting closer and this is a spot that bulls haven’t had much luck with in the past few months.
This places even more emphasis on that Tuesday CPI report and if we do see that come out above-expected, logically USD/JPY could rally aggressively on that theme. There may still be a more attractive case for Yen-weakness elsewhere, however, but at this point, buyers have put in a statement move through early-Q3 trade and the door is open for that next test of the 148.00 handle.

USD/JPY Daily Price Chart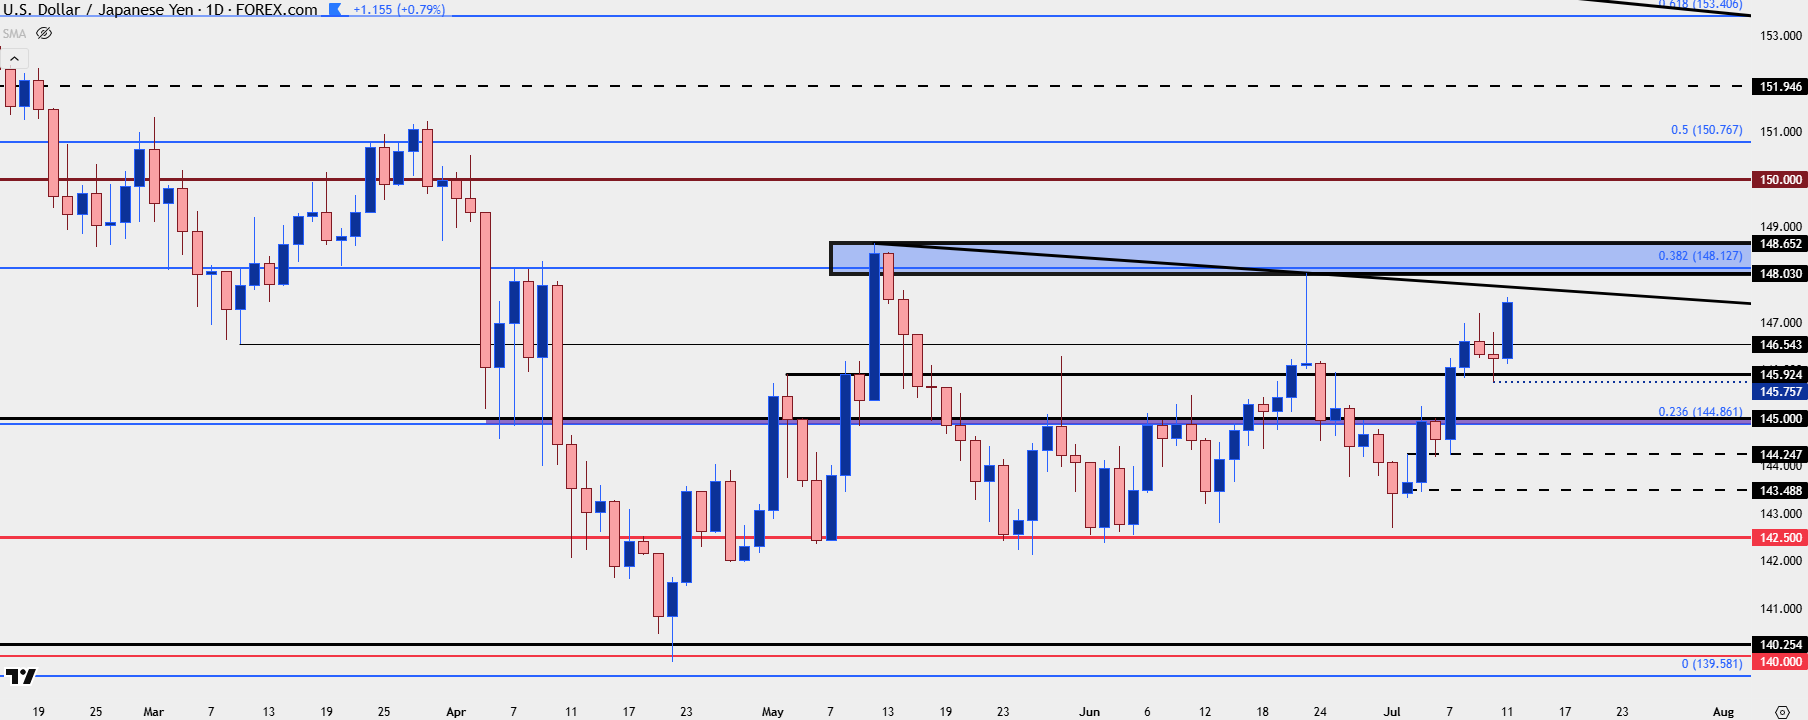
Chart prepared by James Stanley; data derived from Tradingview
— written by James Stanley, Senior Strategist